Radical Transparency
Lately, we’ve been getting several questions from clients regarding the performance of our taxable accounts. While we can’t publicly publish performance numbers due to legal constraints, we are always happy to walk you through your portfolio’s performance in detail! Just contact your lead advisor if that is something that interests you.
In the meantime, we can share our approach to structuring our taxable accounts: our tax-sensitive, wide mode, and builder strategies, to be exact. Now, you’ll have a line of sight into what goes on behind the scenes with your money.
Full warning, this is going to be a deep dive! We’ve done our bests to make these concepts graphics-oriented, but this topic does require a fair amount of data and tables. So hang with us.
How We Measure Performance
To start, let me set the stage that all the numbers you’re about to see are based on hypothetical accounts. Everyone’s account won’t always reflect these traits; they are simply the theoretical models to evaluate performance against benchmarks. That way, if our portfolios aren’t tracking the way we expect, we will know why.
How do we monitor our account performance? We’ve made it simple with the acronym S-A-M-U-R-A-I:
Specified in advance
Appropriate
Measurable
Unambiguous
Reflective of current investment options
Accountable
Investable
Throughout this blog, we’ll walk through examples of how we monitor performance — using only the highest Chartered Financial Analyst, CFA, standards.
Manager Selection
Regarding manager selection, our approach is generally to ask, “Did you beat your benchmark or not?” And, more importantly, “What benchmark did you choose to measure it against?”
Any easy way to think of this concept is pictured above. Look at the big box (above) as our benchmark, with increasing performance and excess return. The excess return can either do better or worse than the benchmark. For example, over the last five years, there has been a negative access return.
Asset Class Domes
Asset class domes are the mix of stocks and bonds in your portfolio. These can exist across all asset classes, but the math gets more confusing each time you add additional asset classes. For this example, let’s consider a 60/40 portfolio.
At GWS, we generally recommend overweighting equity and underweighting fixed income, especially given today’s inflation risk. If you’re in bonds, you risk eroding your principal and purchasing power.
So, if you had a risk profile that suggested you should be a balanced investor, GWS would likely recommend an 80-20 allocation but measure it to a 60-40 benchmark. Then, you have precise data to use to analyze if our active weights helped or hurt performance.
Another way to look at this is with a bar chart. On the left, you have stocks, where we have 80% vs. 60% in the benchmark and 20% bonds vs. 40% bonds. Then, if you get into more detail, you can see the net difference of 20% positive and negative. That’s the way we look at portfolios; what’s the net relative to the benchmark?
Now let’s look at the effects of performance. For example, we have stocks performing at 12% and bonds performing at 4% in our hypothetical with weights.
We would say stocks multiplied by 60% equals an 8.8 in benchmark between the stocks and the bonds. But 7.2% of that 8.8% was attributed to equity performance. Then, if we look at bonds, we get 160 basis points.
Now, let’s look at our 80-20 allocation. We added 20% extra to stocks, resulting in a 9.6% return for our equity position and 0.8% for our bonds. That’s 10.2 vs. 8.8 — meaning investors are pretty happy relative to their benchmarks.
For detailed performance metrics, please don’t hesitate to contact your lead advisor. And, in the meantime, be sure to keep up to date on Gatewood Wealth Solutions through our daily 3x3s and our weekly market insights on our YouTube, LinkedIn, and Facebook accounts.
All examples are hypothetical and are for illustrative purposes.
The opionions voiced in this material are for general information only and are not intended to provide specific advice or reccomendations for any individual. All performance references is historical and is no guarantee of future results. All indices are unmanaged and may not be invested into directly.
Securities and advisory services are offered through LPL Financial, a registered investment advisor, Member FINRA/SIPC.
Consumption Over Investment
During last week’s weekly market insights webinar, John and I continued our conversation on debt and inflation. Of course, we are no stranger to these themes on our calls — but they’re becoming more timely than ever with the media hype around inflation. So let’s start by talking about debt. Is it good? Bad? Possible to be both?
Before we dive in, let’s review the definition of debt and the types that exist:
Debt, by its simplest definition, is an exchange of present goods for future goods. Today, we’re breaking debt into two categories: 1) consumption debt and 2) investment debt.
Let’s think of this as a pension system, considering government debt.
If you are in a pension system, you take a reduction in what you could consume via the decrease in your current pay. The government will use that reduction to purchase investments, the profits of which they’ll use to pay you back through Social Security and other payment vehicles.
Let’s walk through four concerns we’re seeing in data surrounding our national debt.
Problem 1: Less Economic Growth
Chart 1 shows GDP growth per capita in developed, emerging, and developing economies. The blue countries represent a low debt burden to production ability within the economy, and the red represents countries with high debt loads. So, if a country is at 30% or less of its GDP debt, it will grow on average of 2.6%, where those with higher debt burdens will be at 1.7%. Therefore, you can conclude that higher debt loads will offset production.
Problem 2: Disincentivizing Investment and Reducing Productivity
The second problem is an extension of the first. One of the best indicators of an economy’s future growth is its investment rate. When investment increases, so do productivity, which is accompanied by economic growth. Thus, if countries with less debt grow faster, these countries may see more investment and more significant productivity growth. Chart 2 shows how countries with less debt see more excellent investments.
Another way to look at this is production per work. Ultimately, the wages of workers are dependent upon the output of workers. Production is increased through investing, not consuming.
Problem 3: Deteriorating Solvency
We also see an effect on the amount of debt across the world. For example, the amount of public debt relative to tax revenue has increased in Asia, Latin America, Europe, Africa, and other countries worldwide.
If we go back to the great recession, we see the world’s debt has been accelerating. Look at the different regions below and the debt they carried before the 2007 great recession (blue) versus before the 2020 lockdown (red).
Going into the great recession, Japan was at 176% of the debt. Then, going into lockdown, it was at 235%, compared to the United States at 73% before 2007 and 104% in 2020. Therefore, the United States was below average going into the great recession, growing faster than other economies.
Problem 4: The Relationship Between Inflation and Debt Default
The link between inflation and the accumulation of public debt (and sovereign bankruptcy) is relatively recent; as seen in Chart 5, countries that find themselves defaulting on public debt experience more than triple the inflation rate of countries that honor their commitments. However, in the twentieth century, due to the change in the monetary system, it became possible to pay off public debt through inflation.
History Does Not Repeat, but if often Rhymes
We don’t know what history will look like, but we have an idea of what it’s trying to achieve.
Once again, not just in the U.S. but across the globe, debt is trending upward. Japan is the highest at 257% of debt to GDP, with the United States at 133%. However, you do have some European countries that are relatively low as well.
As we’re in an inflationary system, we are not calling on what inflation will be. But since the U.S. government has been making consumption loans, the United States should be positively affected if we get infrastructure spending.
Keep up to date on Gatewood Wealth Solutions through our daily 3x3s and our weekly market insights on our YouTube, LinkedIn, and Facebook accounts.
Stock investing includes risks, including fluctuating prices and loss of principal.
Economic forecasts set forth may not develop as predicted, and there can be no guarantee that strategies promoted will be successful.
The opinions voiced in this material are for general information only and are not intended to provide specific advice or recommendations for any individual. All performance referenced is historical and is no guarantee of future results. All indices are unmanaged and may not be invested directly.
Securities and advisory services are offered through LPL Financial, a registered investment advisor, Member FINRA/SIPC.
Debt Clock
Federal debt is a new hot topic on our minds today. Currently, we’re looking at more than $28.3 trillion — which breaks down to more than $85,132 in debt per U.S. citizen. How long can we sustain this level of debt — and are we in danger of watching it collapse?
Let’s start by comparing the 2000 to 2021 debt clocks, which show us how drastically debt has increased over time. You can even watch the live debt clock here.
As you are comparing these images, keep in mind that the U.S. has seen an 18% increase in population (281 people to 333 million). The workforce has increased 21%, growing from 103 million people to 125 million. That means the workforce has grown faster than the population, with the millennials being a large part of growth.
Next, let’s look at CPI, money over time. A basket of goods that was $169 in 2000 would now cost you $266.83. So what do those changes look like from 2000 compared to 2021? Again, the revenue or GDP (Gross Domestic Product, shown in green) is at $22.1 trillion, and the federal tax revenue is bringing in $3.4 trillion.
When comparing both data sets below, we can see that the GDP is now at $22 trillion, where it was at $9.5 trillion in 2000 – a 131% increase. Then, if we look at tax revenue, we have a 78% increase since 2000. Remember, there was a surplus in 2000, so now we’re at $3.4 trillion in revenue.
So, let’s talk about the different tax breakouts. We have income tax with an 83% increase, payroll tax at a 108% increase, and corporate tax revenue with a rise of 7%. Therefore, revenue has grown, but you can see the corporate tax has stayed the same due to the recent tax law changes favoring taxing income over corporations.
U.S. National Debt
As of June 11th, U.S. national debt was at $28.3 trillion. The federal spending was at $6.7 trillion with a deficit of $3.2 trillion. Comparing this to 2000, we can see the GDP grew 131%, our national debt grew almost 400%, and our government spending has grown 285%. Thus, government and deficit spending are showing up as debt, ultimately exceeding GDP growth.
Where is the government spending so much money? The bulk of it can be traced to the four following categories:
-
Medicare and Medicaid: 298% Increase
-
Social Security: 180% Increase
-
Interest on Debt (Net): 77% Increase
-
Defense and War: 137% Increase
Why is our debt expanding at a faster rate than GDP?
It’s disconcerting to realize that our debt is growing more quickly than our GDP. What is the reason for this? Well, several items show as government liabilities coming out of budgets that are still unfunded. These unfunded liabilities equal a whopping $148 trillion, and they include Medicare and Social Security.
Another factor is heightened payroll taxes. In 2000, we had payroll tax revenue of $640 billion and Social Security of $400 billion. So essentially, we were collecting more than what we were paying out.
Medicare Enrollment
Let’s look at Medicare and Medicaid next, where we continue to see increased enrollment. In 2008, we were at $605 billion in net spending, with a trend going up to $1.2 trillion through 2030. Spending will continue to progress — not to mention become more complicated with government borrowing as the expansion is monetized.
If we include the expense for interest rates on government spending in 2000 and 2021, we have $5.6 trillion in debt. The average interest in 2000 was 4%, where today, the average claim is 1.4%. That’s a significant reduction in the rate.
The moral of the story? National debt may not be going anywhere soon. But by staying ahead of it and understanding it, we can make more informed decisions about the way we invest our money.
Keep up to date on Gatewood Wealth Solutions through our daily 3x3s and our weekly market insights on our YouTube, LinkedIn, and Facebook accounts.
Stock investing includes risks, including fluctuating prices and loss of principal.
Economic forecasts set forth may not develop as predicted, and there can be no guarantee that strategies promoted will be successful.
The opinions voiced in this material are for general information only and are not intended to provide specific advice or recommendations for any individual. All performance referenced is historical and is no guarantee of future results. All indices are unmanaged and may not be invested directly.
Securities and advisory services are offered through LPL Financial, a registered investment advisor, Member FINRA/SIPC.
Bound up Supply
Supply Chain Stoppage
During the COVID-19 global lockdown, supply chains around the world halted overnight. Conex boxes (or shipping containers — pictured above) can only be moved on and off a boat one at a time. You can imagine how this immediately created supply chain bottlenecks that only compounded over time.
Already, the U.S. is not only back to pre-lockdown import numbers but 20% higher. Our exports have decreased, and we’ve added ships. This created physical bottlenecks at ports because there is only so much ship volume one port can handle. The same issue happened to railways and airlines and an abundance of volume without enough infrastructure to support it.
The Country Re-Opens
During the height of the lockdown, American’s spending on service-oriented industries — such as restaurants, hair salons, etc. — completely halted. Instead, we brought in more essential, tangible goods, which led to an increase in imports.
Now, as the United States opens up, we’ll shift our spending money back to service-related industries, thus decreasing the demand for imports.
You might hear the Federal Reserve use the word “transitory” to describe inflation — suggesting it will be short-lived before bouncing back. But it’s unlikely that many of these commodity prices will ever reverse back to pre-pandemic levels. And we are going to see other waves of inflation, such as federal policy tariffs. Just recently, the U.S. government announced they would double the tariffs on softwood imports coming in from Canada. Pre-pandemic, a thousand feet of lumber cost $396. Now, that number is up to $1,700.
Where Should I Invest Now?
When considering how to invest your money in an economic environment like this one, it’s helpful to prioritize preserving not your principle but your purchasing power. In other words, it’s essential to consider your investments in the context of inflation.
So, let’s look at current stock risk. Looking at the data set above, you’ll see stocks are riskier than bonds. However, that’s not to say that you shouldn’t have bonds or you shouldn’t have cash. If you have a one- to three-year horizon, you should insulate some of that risk by holding the money you need during that time.
What Is the Effective Funds Rate?
If you want to become and remain financially self-reliant, it’s going to be stocks that get you there. Just consider 1802-2013 in the graph below, where you’ll see a pronounced real return after inflation.
Stocks have performed at 6.6% long-term, while bonds only made it to 3.5%. A few sub-periods to include:
-
1802-1870: No big central bank moved the interest rate; it was more market-determined. We can see the bonds during that period paid 4.8% versus stocks’ 6.7%.
-
1871-1925: We see stocks at 6.6% and bonds at 3.7%. State-sponsored banks were helping keep interest rates lower in each condition, so bonds were suppressed.
-
1926-2013: The Central Bank was established and quickly started increasing the money supply. This decreased interest rates, so bonds have not been able to keep up with the same types of return.
In the post-World War II periods of 1946-1965, bonds went to -1.2%, and stocks were at 10%. In the 60s to 80s, you see high inflation with no real return. Looking at the effect of the federal funds rate in the 1960s, you can see interest rates were low, similar to where they are now. Now, we wait and see if history will repeat itself — while keeping a finger on the pulse of the economy and market movement so that you can make informed decisions about your money.
Keep up to date on Gatewood Wealth Solutions through our daily 3x3s and our weekly market insights on our YouTube, Linked In, and Facebook accounts.
Stock investing includes risks, including fluctuating prices and loss of principal.
Economic forecasts set forth may not develop as predicted, and there can be no guarantee that strategies promoted will be successful.
The opinions voiced in this material are for general information only and are not intended to provide specific advice or recommendations for any individual.
All performance referenced is historical and is no guarantee of future results. All indices are unmanaged and may not be invested directly.
Securities and advisory services are offered through LPL Financial, a registered investment advisor, Member FINRA/SIPC.
A SAD Story – Supply and Demand
Inflation as a Major Headline
Going back to 2004, inflation was still reasonably new. We can see that going into 2014, the number of people searching for inflation was significantly higher.
Now, inflation has been dominating the headlines. According to the graph below, the Purchasing Price Index (PPI) and Consumer Price Index (CPI) have gone up relative to where they have been. However, this is an annualized component. As one product moves up in value, there’s usually less money for most consumers to spend elsewhere. Therefore, other products are going to pull back.
Look Under the Hood
What’s driving the broad index up?
On the far left of the bar chart, we see reopening prices, such as transportation services. For example, as the economy’s reopening, people are buying airline tickets. The increase in sales of those tickets will create demand, causing an increase in value. Air travel is also very energy-dependent, so there will be increases in fuel. Remember, we have temporary supply disruptions, not just the demand component.
Also, car prices have driven the CPI up. Semiconductor manufacturers anticipated lower demand in the automobile industry. The number of conductors in cars was only the ignition, but fuel injection and LCDs have become more popular. The cost is 50% of manufacturing; however, there is a significant shortage. Therefore, new cars are not coming off the lot as fast, and demand for used cars has gone up dramatically, pushing the CPI up.
Supply or Money Problem?
Traffic coming from Asia going into Los Angeles ports is causing a backlog due to high demand, ultimately making it difficult to get products in the United States. There have been about 19 ships anchored, with the average waiting time at 6.6-6.8 days before drop off. They expect the wait to be cleared by June 1st. The supply of goods coming in and the amount of imports is causing price increases.
Then, we have lumber. Sawmills have been closed during COVID because they didn’t expect housing to increase rapidly. As people move from California and New York to states with low taxes and less regulation, they’re leaving their houses unsold. Not only will the supply of lumber need to be steady, but it will also increase because there’s a need for a lot more homes. Another unique characteristic of the coronavirus is dining out, causing a ketchup package shortage. It’s both a supply and demand problem.
Then, there’s the infrastructure problem, and there have been investments in renewable energy. For example, Texas had 20-30% of its energy supported by renewables and newly built gas power plants. We’ll find many solutions that aren’t known over the next several years as this becomes more pervasive. Therefore, new infrastructure is not necessarily dependable.
Now, we don’t just have the new infrastructure, but antiquated infrastructure as well. The bridge crack in the bottom left (above) is connecting West Memphis with Missouri. Not only did it stop the traffic crossing, but the barges couldn’t cross underneath it. However, whenever we look at the infrastructure bill, it’s not dealing with a lot of this; it is more helping individuals and people. There’s been a lot of criticism on what is considered infrastructure on the bill.
Economic Recovery
We will see rising prices in commodities, and one area that’s been a big boom has been copper. Chile had an election to add complications, and the far left in-country has now gained control of the government. They want to nationalize a lot of the commodities procurement industry, which is the primary industry of Chile. They produce 67% of the copper production globally.
In addition, they’re significant producers of lithium, which is crucial for electric vehicles. One of the bottlenecks for electric cars becoming the norm is the amount of lithium that we can extract. Some people are working on making it synthetic, just as much as they are with synthetic diamonds. If we can’t go to the alternative energy and store other power, there will be additional upward pressure on oil.
Wages have Risen
Significantly lower wages below $60,000 have sharp increases. There will still be people getting paid more to be on unemployment and will not take the jobs. We can see it’s certainly affecting the market because the lower-income areas have to compete against benefits.
The more money the lower-income gets, the more they will use for consumption. So they’re going to buy more food, upgrade their shelter, and buy clothing because they have been skimped in those categories. As their wealth increases, their next dollar will be spent on those categories. It’s not going to be spent on savings, stocks, and other financial assets. Therefore, we might see consumer prices from higher wages on the lower-income be an additional wave to deal with inflation.
Stimulus
If we look at the government spending and personal savings rate on the graph above, we can see that a lot of that money is still sitting idle and ready to be put into the market. There’s likely to be a nice uptick in retail sales because most of this money will make it into the economy as stores begin to reopen to the total capacity.
In the market, inflation expectations on bonds are projected to be 2.5-3% inflation for the foreseeable future. It should lead to higher interest rates, but if the Fed is acting as the market and buying up bonds, you could see interest rates stay stable with inflation high.
Price Points for Dollar Cost Averaging
We can see that the S&P 500 bounced off its 50-day moving average. There’s a good chance that we go through the 50-day moving average and try to get some consolidation in the market. However, there could be a concern with the infrastructure and stimulus bills being passed sooner rather than later.
Then, if we glance through the technicals above, considerable cap value is coming back while the S&P 500 is doing better than most international asset classes. We can see commodities near the top, with real estate doing well and Gold moving up.
Keep up to date on Gatewood Wealth Solutions through our daily 3x3s and our weekly market insights on our YouTube, LinkedIn, and Facebook accounts.
Economic forecasts set forth may not develop as predicted, and there can be no guarantee that strategies promoted will be successful.
The opinions voiced in this material are for general information only and are not intended to provide specific advice or recommendations for any individual. All performance referenced is historical and is no guarantee of future results. All indices are unmanaged and may not be invested directly.
Securities and advisory services are offered through LPL Financial, a registered investment advisor, Member FINRA/SIPC.
Labor Pains
Payroll Gain is Amongst Largest Downside Miss Ever
Payrolls rose $266,000 from a month ago, according to a Labor Department report Friday, May, 7th 2021 that represented one of the most significant downsides miss on record. Economists in a Bloomberg survey projected a $1 million hiring surge in April 2021.
Catching the media’s eye, there is some concern from a miss standpoint. This would be the biggest miss ever at more than three standard deviations out from the mean, so in other words, it shouldn’t have happened.
McDonald’s Struggle with Unemployment Benefits
The National Owners Association (NOA) is an organization “to unify Owners to “Lead Together Again” and save our culture while assuring the owners have net cash flow growth, financial viability and are immune from intimidation and retribution.” McDonald’s is a part of this organization. They’re having trouble hiring employees due to unemployment benefits and say an ‘inflationary time bomb’ will force them to hike Big Mac prices up.
Here are a few key quotes from the NOA letter to its members:
“What’s going on here? When people can make more staying at home than going to work, they will stay at home,” the letter read, which was obtained by Insider. “It’s that simple. We don’t blame them. We fault the system.”
“Natural human behavior is to choose to receive more money while staying at home than working for a highly demanding job — especially with the amount of stress that is being put on employees right now.”
Welfare Wall- Economy
In the below chart from Gary Alexander, Secretary of Public Welfare, Commonwealth of Pennsylvania, explained, “a single mom is better off earnings gross income of $29,000 with $57,327 in net income with benefits than to earn gross income of $69,000 with net income and benefits of $57,045.” They came up with this ten years ago. So $69,000 is a good salary now, but an excellent salary then. The skillset that is needed to bridge that gap would be pretty difficult to cover.
But what was more shocking is the chart below that Steven Rattner, New York Investment Asset Manager, tweeted. The chart showed tens of millions of US workers, in jobs ranging from the dishwasher, to the hotel clerk, to preschool teacher, to anyone on minimum wage, can now earn more from unemployment than from their regular job.
If you look at the unemployment bar, people get an equivalent of $11.23 to $7.25 per hour for minimum wage. Also, the median salary of $20.08 is compared to $17.78. As you can see, unemployment benefits have affected different parts of the labor market differently.
So, what is the other argument outside of just unemployment benefits taking up additional employees?
If you look at who is going back to work, there are many more men represented than women. It may not be disincentives, but rather the burden of children still at home from school falling on women, not allowing them to go back to work. Another problem with this is the question of the labor market having to compete with the government to get these people to come back to work.
We are not seeing the polls that you would expect if they were competing with the government. You would expect the low-wage employment to be rising as they’re trying to offer higher benefits to attract the person coming in.
The next issue is regarding the miss and not showing up in other datasets. If we look at the chart below from ADP Research Insitute regarding data leisure, hospitality, trade, and transportation, these areas pick up the most jobs and have the most job openings.
The data shows $742,000 of payroll gain compared to $266,000 from the Bureaus of Labor Statistics. At the moment, GWS believes a lot is going on here, and probably a significant part is sampling. The Bureau of Labor Statistics is trying to control things such as working part-time, contracting, going full-time, how many companies have been created, and how many companies are lost, ultimately showing a sample error.
Effects on the Stock Market
What has been driving the stock market is stimulus, whether it’s a federal stimulus or not. The federal reserve still sees these unemployment numbers, and they have a dual mandate to maintain the purchasing value of the currency and keep unemployment low. They think inflation’s transitory, moving to a 36 month rolling 2% average. When we look at the data, we have some low numbers going back 36 months.
They think inflation isn’t a thing, but they are working out of a paradigm, a trade-off between inflation and unemployment. Whatever the reasoning behind the actions is, the Feds are going to continue to be accommodated. Next, we have unemployment data that says the recovery isn’t happening as quickly as we like. CPI is on an annualized basis at 0.8, that’s 9.6%. You can see in the chart below if inflation did cause interest rates to move up, then the 30 years could be down 20% and the ten years down 8-9%.
Keep up to date on Gatewood Wealth Solutions through our daily 3x3s and our weekly market insights on our YouTube, LinkedIn, and Facebook accounts.
Economic forecasts set forth may not develop as predicted, and there can be no guarantee that strategies promoted will be successful.
The opinions voiced in this material are for general information only and are not intended to provide specific advice or recommendations for any individual. All performance referenced is historical and is no guarantee of future results. All indices are unmanaged and may not be invested directly.
Securities and advisory services are offered through LPL Financial, a registered investment advisor, Member FINRA/SIPC.
Historical Limericks
The Roaring Twenties
We continually compare what we’ve gone through over the last decade to the roaring twenties. If we go back and look at the stock market, especially the crash as we went into the thirties, a lot was going on more than just the stock market.
GWS compares what is happening currently to the twenties because of how the money supply was used: coming out of the progressive era with World War I just ending. Much of the government spending was curtailed because the war had ended, and we had an advanced period of central banking. However, there was also a legacy component of cutting government spending and taxes to stimulate the economy. But what wasn’t happening in the 1920s was the rampant laws and unfair capitalism.
Money Supply in the 1920s
In the twenties, we had a currency that was outstanding with not much change. It was timed deposits, what we call Certificate of Deposit (CD) now, and demand deposits increasing behind the scenes. So, the central bank started to grow because there was a gold-backed system. We can see it can affect the money supply in Column 8 (below), rising about 70% over the decade.
Gatewood Wealth Solutions believes that the amount of money being created will make it into capital markets or capital assets first and cause an appreciation in those assets. Between 1920-21, we went through a recession with a lot of the government spending is for World War l with deflation in the system. Therefore, the federal reserve saw it in the index and began to expand the money supply.
Also, when World War I ended, Europe was very much devastated, and they needed foreign loans—allowing these foreign loans to be made by the U.S. to Europe. In turn, the loans were used mainly to buy exports from the U.S., specifically agriculture. The overall point is when we see the money supply expand, the market expands right along with it.
The graph above is looking at the annual percentage of change in the money supply. The yearly change is quite variable: 4% up to 10% of basically 0% right before the crash. However, it does not state when the money supply got near zero in terms of new and additional money into the system.
We can see (above) the money supply takes off with a lag coming out of the first recession. Then, there’s a more stable money supply as growth begins to slow. Next, we get into the 24-25 period when England is trying to go to the gold standard. The Fed lowers interest rates again, and we see lag, but it corresponds to an increase in capital markets. The money supply begins to stabilize for a short amount of time with a little bit of flatness in the market. Lastly, going into 1928-29, we start to see the Fed slow, getting down to a 0.7% growth rate. Then, the crash occurs.
However, the point is, the money supply was increasing dramatically along with the capital markets. Though the money supply expanded in the right direction, we didn’t see inflation growing somewhat rapidly. The Fed was expanding the money supply based on a stable basket price and allowing them to continue to raise the money supply and see the capital market.
In the Inflation Basket graph above, we can see a 68% increase in the total money supply over time, but we do not see inflation above 4% whenever we measure it as a basket of goods. Coming out of World War l, command and control components were put on the economy to provide war goods. As those were ending, a lot of the government spending was ending too. Therefore, as the economy restructured, prices were falling in the goods in the basket without stabilization. The Fed used an inflation basket to gauge how much money they should create to get to a stable price.
The economy in the 1920s
Most places that people lived were getting electricity, and with that comes new labor-saving appliances such as a vacuum, washing machine, and toaster. Also, instant communication is occurring through mass media, such as the radio. You were able to pick up a phone and connect with people across the world. The new invention of a vehicle came about to go further away to find better economic opportunities. Like today, we have a lot of new technology coming in, causing an increase in productivity.
This is all one big cycle as farms were starting to be mechanized. The tractor was becoming something that farmers were using to increase agricultural output dramatically. People were leaving the urban environment because farms could produce food. Therefore, the higher-cost producers had to go, but there was plenty of jobs at the factory. The demand for labor kept prices up, causing the production capacity of the economy to grow faster than the money supply.
However, it was causing an imbalance because food prices started to decrease. Money was being borrowed for the farm implements. Therefore, there were a lot of bankruptcies, especially whenever there was inflation. The Fed eventually slowed the money supply causing the crash.
“If we’re living in something like the 1920s, will we have the same outcome?”
GWS does not think the next phase will look like the 1930s. We believe the Fed will be swift to continue to expand the money supply because they’re not concerned about a rise in inflation. They would welcome inflation to offset some of the deflationary pressures.
Averaging out the average 2% will allow prices to increase. If we can’t maintain this productivity gain that we’ve had over the last couple of decades, our experience will be more like the 1970s, where you have inflation as the outcome and not deflation.
Keep up to date on Gatewood Wealth Solutions through our daily 3x3s and our weekly market insights on our YouTube, LinkedIn, and Facebook accounts.
Economic forecasts set forth may not develop as predicted and there can be no guarantee that strategies promoted will be successful.
The opinions voiced in this material are for general information only and are not intended to provide specific advice or recommendations for any individual. All performance referenced is historical and is no guarantee of future results. All indices are unmanaged and may not be invested directly.
Securities and advisory services are offered through LPL Financial, a registered investment advisor, Member FINRA/SIPC.
A Purposeful Life
As some of you may know, this Sunday is a special day for me; it will be my first Mother’s Day. My husband, Kyle, and I were blessed with two beautiful baby girls last year, and they are the lights of our lives! Nothing gives me more joy than to watch them continue to grow and develop their personalities.
What you may not know is that I am also celebrating another milestone this year: being cancer-free. Just after I had my twins last summer, I learned I had cancer and immediately began treatments. It was a whirlwind undergoing chemo, learning to be a first-time mother to twins, and figuring out what the future looked like for our family. While I am happy now in remission, that time last summer is etched into my memory — the barrage of emotions, the weighty decisions, the vast life adjustments.
During this time, I also gained tremendous clarity on what it means to have a purposeful life. And it got me thinking about how we help our clients find purpose in their lives, too. Our Chief Development Officer, Daniel Goeddel, issued a challenge to our firm last summer to develop our individual “elevator pitches” for the firm. The one-sentence lines we would use to tell people about the heart and soul of our firm and what makes us different.
As I lay in my hospital bed for a week, having come down with an infection due to my chemo-compromised immune system, Dan’s challenge came to mind. It was the first time I was away from the twins after they were born for more than just one night,and I couldn’t have any visitors because of Covid-19. As I lay there, pondering, a phrase suddenly came to me:
“We give purpose to your money so that you can be present in your life.”
Let me tell you what I mean by this.
When you hold your newborn baby for the first time, and they wrapped their finger around yours, were you thinking, “Do I need to increase my investment exposure in the technology and financial sector due to current market conditions?” No.
When you are watching that same child walk across the stage at their graduation as they lift their diploma in excitement, will you ask yourself, “What is the tax implication of withdrawing the left-over funds in their 529 accounts?” No.
When that child yells “Happy Retirement” as you walk into a room filled with your closest family, friends, and co-workers celebrating the end of a 40-year career, will it cross your mind? “Did I save enough money to last the next 40 years and continue to live the lifestyle that I have become accustomed to?” Of course not.
And when that child stands beside your grave after peacefully passing away in your sleep after a long 90-year life, they won’t have to be thinking, “Did Dad complete his estate planning documents and have insurance in place to plan for our family?” That will be the last thing on their mind.
Why? Because you are our client. Here at Gatewood Wealth Solutions, we give purpose to your money so you can give meaning to and be present in your life. With your goals as our objective, we look at all aspects of your financial situation, from income and estate tax planning to risk and investment management. We provide solutions to life’s most challenging questions through a customized service commitment based on your family’s complexity, leaving you free to enjoy life’s best moments.
Life’s best moments might be different for everyone. But for me, these are the moments I spend with my growing family — for whom I am incredibly thankful this Mother’s Day.
Securities and advisory services are offered through LPL Financial, a registered investment advisor, Member FINRA/SIPC.
Gatewood’s Five-Step Approach to Cash Management
At Gatewood Wealth Solutions, we pride ourselves on keeping our clients “Bear Market Ready, but Bull Market Positioned.” By this, we mean that we help clients calculate an emergency fund — what we call their “Cash Target” — seeks to protect them during down markets. Then, the rest goes into the market, where it can seek growth.
Our firm has worked hard to develop an approach that allows us to pinpoint exactly where that “sweet spot” is, based on clients’ expenses, life stages, and our investment committee’s outlook on the market. Our financial planning and investment management teams work closely together to ensure no stone goes unturned in making this assessment.
How do we come to this number, which we call a client’s Cash Target? We’re glad you asked.
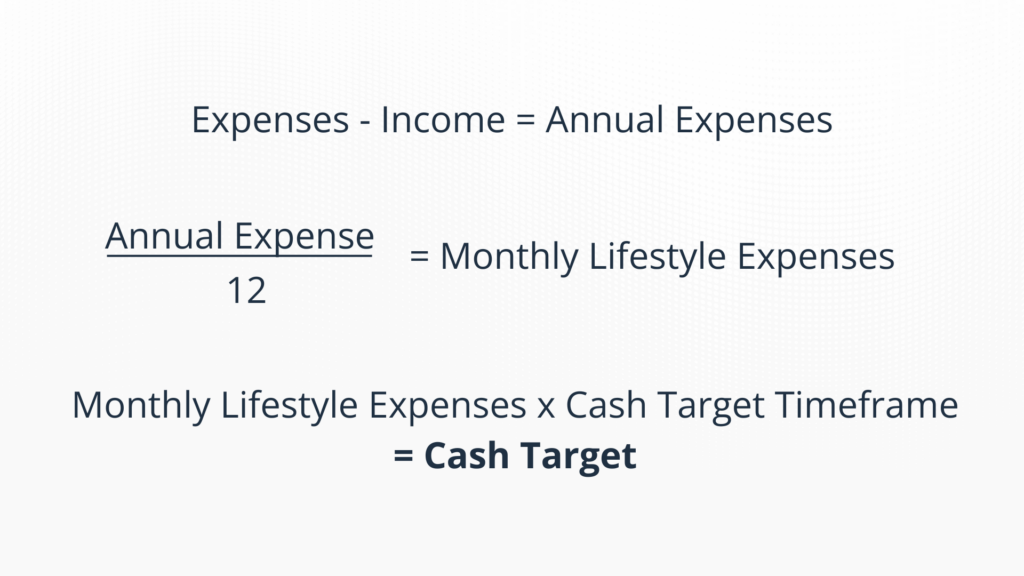
Step 1: Determine the client’s total annual expenses.
We start by totaling the client’s annual expenses. These include lifestyle expenses, taxes (including federal, state, and property), insurance, liabilities, charitable giving, insurance payments, and other costs. Then, we assess if there are expense changes during the “Cash Target Timeframe.” If so, we include this in the Cash Target formula by finding the cash target each year, as you will see in Step 4.
Step 2: Evaluate the client’s income.
Once we determine a number for annual income, we again review any year-to-year changes by identifying specific Cash Targets for each year if the income fluctuates.
Step 3: Incorporate the Investment Committee’s current Cash Target Timeframe.
Our Investment Committee regularly evaluates market conditions to make recommendations for ideal Cash Targets. For example, pre-pandemic, the general Cash Target was 24 months. By January 2021, our investment committee increased the target to 33 months. As you can see, the “Cash Target” — the amount we recommend clients keep on hand in cash — expanded as the market became more uncertain. And it will likely shrink back again as the market gains stability.
Step 4: Calculate the Cash Target
Next, we move on to the actual calculation. We know life (more precisely– income and expenses) is not the same year after year. Therefore, we developed a formula to consider those income or expense changes:
If no expense or income changes:
If an expense or income changes:
-
Year 1: Expenses – income = Annual Expense /12 = Monthly Lifestyle Expense X 12 = Year 1 Cash Target
-
+ Year 2: Expenses – income = Annual Expense /12 = Monthly Lifestyle Expense X 12 = Year 2 Cash Target
-
= Cash Hub Target
Note: If more than 24-month Cash Target, we would continue the process (+ Year 3 Expenses – income = Annual Expense /12 = Monthly Lifestyle Expense X 12 = Year 2 Cash Target).
Step 5: Fund the Cash Hub Account
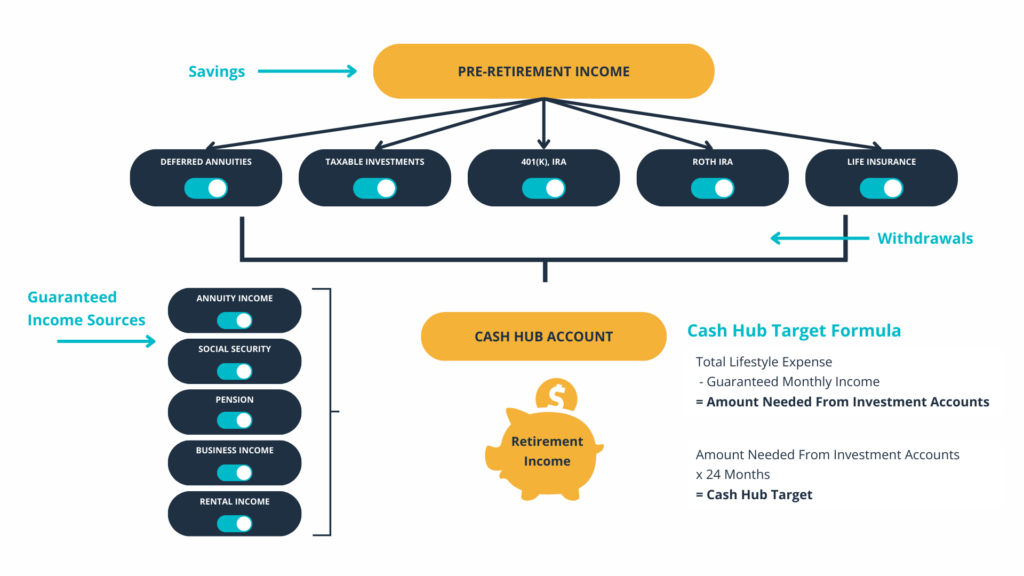
Once we have the Cash Target amount, we calculate and fund the Cash Hub Account. For example, if your cash target is $240,000 and you have $100,000 in your checking/savings account, we would fund the Cash Hub Account at our firm with $140,000. However, the big questions are – which accounts do you pull from and when? To answer this, we consider tax qualification and tax brackets, liquidity concerns, and legacy goals.
The cash hub account is just one small part of our overall distribution planning approach, which you can see below. Our planning team constantly turns these funnels on and off based on our clients’ specific financial situations and life goals. We can make sure we correctly put our clients’ money to work for them while maximizing their tax-saving strategies.
All investing involves risk, including the possible loss of principal. No strategy assures success or protects against loss. There is no guarantee that a diversified portfolio will enhance overall returns or outperform a non-diversified portfolio. Diversification does not protect against market risk.
The opinions voiced in this material are for general information only and are not intended to provide specific advice or recommendations for any individual. All performance referenced is historical and is no guarantee of future results. All indices are unmanaged and may not be invested directly.
Securities and advisory services are offered through LPL Financial, a registered investment advisor, Member FINRA/SIPC.
You’re Retiring – Now What?
When our GWS team meets with prospective clients, one of the first questions we ask is, “What brought you in today?”
Most of the time, these prospective clients have undergone a significant life event — such as receiving an inheritance, going through a divorce, nearing retirement, or experiencing a liquidity event — that made them decide to seek professional guidance for their financial futures.
It may not come as a surprise that the most common reason clients walk in our door is, “I’m retiring.” Retirement is something most of us work toward for decades, but it can be overwhelming as it approaches. We’re here to help simplify the process for clients by sharing our experience with you to help you become and remain financially self-reliant.
Here are the top eight steps your GWS team will help you complete when you decide to retire.
1. Calculate your Cash Target
At GWS, we recommend identifying your Cash Target two years before you retire. However, if you are new to retirement planning with our firm, there is still time. Your Cash Target is essentially your emergency fund. This is important, so you never have to liquidate your investments when the market is down. Selling your investments during a market correction could have a significant impact on your success in retirement.
Below is the formula used to calculate your Cash Target – the first step is calculating your expenses. It might sound daunting to figure what your costs will be in retirement, but your GWS advisors will help you do the rest of the work if you have that number.
The “Cash Target Timeframe” above comes from the GWS Investment Committee, based on the underlying market and economy, and gets revisited quarterly. Our Cash Target Timeframe ranges from 24-36 months.
2. Calculate & Fill your Cash Hub Account Target
The next step is to calculate and fund your “Cash Hub Account Target” – in other words, the amount you need from your investments held in an account at our firm that we refill or spend down every quarter.
Depending on the tax qualification of your assets and the timeline of your income and expenses, funding and monitoring the Cash Hub Account can be complicated. Our team is here to help take the guesswork out of the process.
3. Contribute Tax Efficiently in the Year of Retirement
Whether your retirement is your highest tax bracket year or one of your lower tax bracket years, working with our team to determine how to maximize your tax-efficient contributions is vital. For one client, the best scenario could be maximizing pretax options in their 401(k) or contributing to a Donor Advised Fund for a tax deduction. While for another client, the best scenario would be to contribute to a Roth 401(k) and do a Roth Conversion in the year of retirement. Having the ability to leverage flexible tax treatment in years of higher (or lower) income is essential in this step.
4. Review Retiree Benefits Package
Your GWS team can help provide you a summary of everything you can expect from your benefits, including:
-
Options with Regards to your Employers Sponsored Retirement Plans
-
Pension Benefit Amount & Election Options
-
Deferred Compensation Plan Payout
-
Employer-Sponsored Health Insurance
Some of these benefits can get complicated because they vary based on time of service, years of compensation, age you want to take your benefits, and how the income stream is set up going forward. Also, you must decide which pension or deferred compensation elections make the most sense for you. If given the option, should you take it all at once? Spread out payments via an annuity?
Understanding how your benefits package affects your other assets and financial planning is essential. The more plans you have, the more complicated it gets because different structures are available to you. Your advisor will help you walk through all your options and determine what makes the most sense for your financial situation.
5. Access Health Insurance Options
If you are younger than 65 and do not have employer-sponsored health insurance, you will have to supply your health care coverage through vehicles such as COBRA, or if your employer doesn’t offer a COBRA plan, you can try the Affordable Care Act (Obamacare).
Employing this option and depending on your income, you may even qualify for a subsidy. But open enrollment periods are limited, and you must plan your retirement accordingly. Other insurance options include less robust coverage choices with short-term plans. These plans are usually viable for generally healthy people who have no pre-existing conditions.
6. Elect Social Security
Social Security can be confusing — let alone understanding how to maximize it. Your advisor can help walk you through all the pros and cons of when you and your partner should elect to take it.
At GWS, we have our own Social Security Maximization Process to help you determine how to get the most Social Security benefits for you and your family. We can help you visualize the financial implications of electing your benefit early, at full retirement age, or later in life. That way, you can know what to expect from each possible scenario, allowing you to make informed decisions.
7. Set up a Monthly Withdrawal Structure and Bank Account
Our team will help you create a “paycheck” in retirement! If your company sent you your paycheck twice a month, you might set up your distributions from your Cash Hub Account to mimic that frequency. Having a set schedule like this will make your life easier and help you keep a good understanding of when your money is coming in.
By considering what your exact cash needs will be in retirement, you can make sure that you have the correct distribution funnels in place and money coming out of the bank.
8. Distribution Planning
How do you determine which accounts to pull from and when? This can be overwhelming, but working with our team to create a tax-efficient strategy can save you tens or even hundreds of thousands of dollars over the long run.
It all goes back to the concept of distribution planning, which you can see depicted in our infographic above. Your advisor will help you turn on and off different levers, depending on your tax bracket, to help you take a strategic approach to tax savings.
The hallmark of our culture is our commitment not simply to answer questions but to find clear solutions that lead to better outcomes for our clients. A lot goes into the retirement planning puzzle, but your advisor can help give you confidence that you’ve covered all your bases.
Our highly credentialed team is here to help you and answer your questions. Feel free to reach out to us using the scheduling tool below or give us a call at (314) 924-5100. We would love to hear from you!
All investing involves risk, including the possible loss of principal. No strategy assures success or protects against loss. There is no guarantee that a diversified portfolio will enhance overall returns or outperform a non-diversified portfolio. Diversification does not protect against market risk.
The opinions voiced in this material are for general information only and are not intended to provide specific advice or recommendations for any individual. All performance referenced is historical and is no guarantee of future results. All indices are unmanaged and may not be invested directly.
Securities and advisory services are offered through LPL Financial, a registered investment advisor, Member FINRA/SIPC.