Chinese real estate developer Evergrande had global markets on edge this week. As loyal listeners to our Weekly Market Insights might recognize, we called out the potential of China’s rapid expansion of their money supply to disrupt the market about two weeks ago (watch the replay here). Let’s dive into what caused China’s housing bubble, as well as what this could mean for the future of the global economy.
Chinese Housing: Bubble Decades in the Making
China’s real estate market leverage has been excessive for over a decade. As a result, there have been reports of substantial concrete structures being built. China has over-leveraged with more concrete units than households. Now, because China has been in a bubble for some time, they created a “three red line” policy.
Source: Media Reports, SG Cross Assets Research/Economics
With this policy, China will slow down its bubble and hope for a soft landing. Here are the metrics of the guidelines:
70% ceiling on the debt to asset ratios after excluding advanced receipts
100% cap on the net debt ratio
100% cap on short-term debt cash rate
According to a sales manager of Evergrande Wealth, “more than 80,000 people – including employees, their families, and friends as well as owners of Evergrande properties – bought WMPs that raised more than 100 billion yuan in the past five years.” They call themselves a conservative company; however, they promoted 11-13% rates of return for real estate and leveraged unconditional marketing tactics — such as giving away Gucci bags — to attract customers.
Overleverage
Source: Bloomberg
When we look at Evergrande as a whole, they have about $300 billion in total liability, and $7.4 billion of that is due over the next year. Then diving a little deeper, $850 million in interest payments is anticipated over the next year, and $150 million of that is due in the next two weeks.
Rising Risk
Many are calling this the Lehman Moment, which is referencing a contagion. We do not think China will make the same mistake; however, this does not prevent them from making new mistakes. In short, we do not believe it is a Lehman Moment, but there is a contagion. It will be felt throughout the economy. All economic activity is interconnected. For example, the risk of default and a distressed lender is moving high yield debt rates up in general. Other marginal borrows or distressed borrows are seeing their lending costs increase. It is being felt across the entire debt market. Or it is contagious. Is it enough to create a domino effect; unlikely since the PBOC will step in before this occurs.
A typical retort to the Lehman Comparison is Evergrande debt has tangible assets, not financial assets. First, real estate is both a tangible and financial asset. But the problem is not the physical aspect, but what people are willing to pay for something. Second, if real estate prices drop precipitously, it will not matter how tangible they are if they are pennies on the dollar. (As an example: here is a viral video of 15 tangible buildings being destroyed which were never completed:
The Debt Limit
Source: Goldman Sachs Global Investment Research
Another headline is the spending and debt limit bill that passed in the House on September 21st. It is currently sitting in the Senate. The bill has a suspension of the debt attached, but since it is a spending bill, the Republicans can filibuster it. They likely will play this game of chicken. The House Speaker is scheduled to deal with the infrastructure bill on the 27th. In short, there is little time, and the U.S. government could default in October if the debt limit is not extended. We expect accusations to fly, but ultimately the debt limit increase will be a separate bill that can be passed through reconciliation (Republicans cannot filibuster); however, the debt limit will not be suspended but only increased, meaning the big spending bill will be delayed. We are watching closely. We consider a default unlikely, but then the political climate is not conducive.
Keep up to date with the rising risk of Evergrande in China and more every Wednesday at 3:30 p.m. C.T. And to learn more about this week’s Weekly Market Insights, be sure to listen to our recap video on our YouTube channel and SUBSCRIBE!
—
Disclosures:
Economic forecasts may not develop as predicted, and there can be no guarantee that strategies promoted will be successful. Therefore, the opinions voiced in this material are for general information only and are not intended to provide specific advice or recommendations for any individual.
All performance references are historical and are no guarantee of future results. In addition, all indices are unmanaged and may not be invested directly.
Securities and advisory services are offered through LPL Financial, a registered investment advisor, Member FINRA/SIPC. All investing involves risk, including possible loss of principal. No strategy assures success or protects against loss.
The opinions in this material do not necessarily reflect the views of LPL Financial.
LPL Financial does not provide tax advice. This information is not intended as authoritative guidance or tax or legal advice. You should consult with your attorney or tax advisor for guidance on your specific situation.
Proposed Tax Legislation Changes
The House Ways and Means Committee made waves Monday when it released a draft of significant tax legislation. Our GWS Planning Team spent the week dissecting these proposed changes to share a quick summary of the key points with you. We’ve already begun building some of the proposed changes into our scenario analysis tools to provide up to date “what if” illustrations reflecting potential impacts to our clients.
Below is a summary of the fundamental changes proposed, as well as related details and implications
House Democrats propose raising the top personal income tax rate to 39.6%, from 37%. That higher rate would reverse a cut signed into law by Trump. The committee also proposed a 3% surtax on individuals with an adjusted gross income of more than $5 million, an idea not included in Biden’s plans released earlier this year. However, this 3% surtax would also apply to trusts with an income of over $100,000.
The proposed top bracket would start at taxable income levels of $400,000 for single ($450,000 married filing joint); this is lower than the president’s plan previously released, which would have the top rate kick in at $452,700 and $509,300, respectively (adjusted annually for inflation).
Implications:
As a result, more high-income Americans would be subject to the top rate under the committee’s proposal. The proposed effective date is for taxable years beginning after December 31, 2021.
The House bill would increase the capital gains rate to 25% from 20%. In addition, a 3.8% Obamacare tax on investment would be added on top, meaning the richest would pay a 28.8% federal rate on realized investment returns.
This proposal is lower than the 43.4% top capital gains rate previously proposed by the president for those with adjusted gross incomes exceeding $1 million ($500,000 married filing separately).
Implications:
The new rate would apply to those in the top tax bracket for long-term capital gains, which in 2021 covers individual filers earning more than $445,850 and married joint filers earning more than $501,600, according to the Ways and Means Committee. The proposed effective date for a 25% capital gain rate is September 13, 2021. The proposed legislative text currently provides that any transactions completed on or before September 13, 2021, or subject to a binding written contract on or before September 13, 2021 (even if the transaction closes after September 13), are subject to the current 20% top capital gains tax rate. Any capital gains recognized after September 13, 2021, are proposed to be subject to the new maximum 25% rate.
This recent proposal would cut in half the estate and gift tax lifetime exemption from the current inflation-adjusted $10 million per person ($11.7 million in 2021) to an inflation-adjusted $5 million. This provision is not included under the president’s proposal, which instead sought to reform the taxation of capital income by creating a realization event at death – removing the “step up in basis.”
Implications:
The proposed change would apply to estates of decedents dying and gifts made after December 31, 2021.
Significant changes are proposed for the treatment of assets transferred to a “grantor trust.” Grantor trusts are trusts where the creator of the trust, the grantor, is deemed the owner of the trust for income tax purposes. In addition, the new legislation would require grantor trusts to be included in a descendant’s taxable estate when the descendant is the deemed owner. This provision was not included in the president’s proposals.
Implications:
Grantor trusts are an essential and frequently used planning tool for lifetime wealth transfers. Under the proposal, assets transferred to grantor trusts would be included in the grantor’s estate for federal estate tax purposes upon the grantor’s death.
#5 Changes to RMDs, After-Tax Contributions, “Back Door” Roth IRA, and Roth IRA Conversions
This legislation would limit contributions and increase the Required Minimum Distributions (RMD) for accounts over $10 millionand $20 million.
It would also eliminate the Back Door Roth IRA strategy for higher-earning taxpayers (with taxable income exceeding $400,000 or $450,000 for joint filers) starting in 2022. Currently, taxpayers may make nondeductible contributions to a traditional IRA and then convert the traditional IRA to a Roth IRA, regardless of income level.
Furthermore, this provision would prohibit all employee after-tax contributions in qualified plans.
Finally, this bill would eliminate the ability to do a Roth IRA conversion if you have more than $400,000 as a single individual or $450,000 married filing jointly; however, this would not be eliminated until 2031.
Implications:
This proposal included many changes to retirement plans for high-income earners, emphasizing eliminating the loopholes for growing IRA and Roth balances if you are over the high-income earning thresholds.
Expected Timing
Speaker Pelosi has indicated that the House plans to enact the infrastructure and the budget reconciliation bills by October 1. The bipartisan infrastructure bill has a planned vote in the House by September 27, which is the last stop before the bill goes to President Biden for signing, assuming the House passes it with no changes from the Senate version.
Congress also is coming up with several fiscal deadlines this fall, including considering a continuing resolution to maintain funding for federal departments and agencies, which is scheduled to expire on September 30.
While this is merely a proposal and may not be passed in its current form, it strongly indicates future law to come. Our GWS team will watch this legislation as it works through Congress and update you on any relevant planning considerations during the upcoming months. In the meantime, feel free to reach out to your lead advisor with any questions or concerns.
—
Disclosures:
Economic forecasts may not develop as predicted, and there can be no guarantee that strategies promoted will be successful. Therefore, the opinions voiced in this material are for general information only and are not intended to provide specific advice or recommendations for any individual.
All performance references are historical and are no guarantee of future results. In addition, all indices are unmanaged and may not be invested directly.
Securities and advisory services are offered through LPL Financial, a registered investment advisor, Member FINRA/SIPC. All investing involves risk, including possible loss of principal. No strategy assures success or protects against loss.
The opinions in this material do not necessarily reflect the views of LPL Financial.
LPL Financial does not provide tax advice. This information is not intended as authoritative guidance or tax or legal advice. You should consult with your attorney or tax advisor for guidance on your specific situation.
China is Not a Contender
Over the last couple of decades, China has experienced more growth and development than we’ve seen in economic history. However, they typically measure growth using the size of their Gross Domestic Product (GDP). That’s a crude metric to use for the ability to project your power into the world.
Source: Business Insider
Above is a chart showing global GDP shares from a historical perspective. It is timestamped from 1000 A.D. to the present and represents the country’s percentage of the worldwide GDP. Production is based on how many people a country has, but it doesn’t tell you about its wealth within industries.
For example, in the 1800s, the United Kingdom’s economy grew dramatically, but the size of China’s economy dwarfed it. However, at the same time, the Opium Wars occurred, where the U.K. left England and defeated China time and time again. So, when we look at wealth per individual in this example, you can conclude many more resources were devoted to the English than to China.
Productivity of China
Source: FRED Economic Data
The graph above looks at how productive people are based on their tools in the economy. So, how effective are individuals in China? Not very productive at $11,000 in GDP, but we can see that their ability to produce products through the nineties and onward was multiplying. This is important because China’s debt grows substantially, and we haven’t seen any production increases. Up until recently, China has also been expanding its money supply five times the federal reserve rate.
Tech Crackdown
When doing business in China, you’re doing business with a communist party with much power over your business. They’ve shown this in the past with tech crackdowns as they have increased regulation, implemented antitrust fines, banned developments of D.D. (a ride-sharing app), and taken over private education.
Market Trades – China vs. the United States
Source: StockCharts
Analyzing how the market has been trading a year to date, you can infer more volatility in the Chinese index. But we see a big run-up in the market in 2021, which since has decoupled from the U.S. market. As a market share, the United States has been significantly outperforming the Chinese market. However, market trades are not the only issue China is dealing with.
Age Ratio
Source: TIME
The age ratio graph shows the young population at the bottom, the working people in the middle, and the elderly at the top. One of the big stories on why China grew drastically is because they have a high population and low labor costs. That means that as labor gets more expensive, there will be an issue with age ratios as China’s population peaks at 1.44 billion in 2029 before entering an “unstoppable” decline, according to a Chinese Academy of Social Sciences study released in January. Also, take into consideration China’s one-child policy. One legacy of the one-child policy is that each generation stands to inherit the wealth of four grandparents and two parents–the flip side of the “4-2-1” phenomenon.
Keep up to date with global GDP shares and more every Wednesday at 3:30 p.m. C.T. And to learn more about this week’s Weekly Market Insights, be sure to listen to our recap video on our YouTube channel and SUBSCRIBE!
——
For detailed performance metrics, please don’t hesitate to contact your lead advisor. And, in the meantime, be sure to keep up to date on Gatewood Wealth Solutions through our daily 3x3s and our weekly market insights on our YouTube, LinkedIn, and Facebook accounts.
Disclosures:
Economic forecasts may not develop as predicted, and there can be no guarantee that strategies promoted will be successful. Therefore, the opinions voiced in this material are for general information only and are not intended to provide specific advice or recommendations for any individual.
All performance references are historical and are no guarantee of future results. In addition, all indices are unmanaged and may not be invested directly.
Securities and advisory services are offered through LPL Financial, a registered investment advisor, Member FINRA/SIPC. All investing involves risk, including possible loss of principal. No strategy assures success or protects against loss.
The opinions in this material do not necessarily reflect the views of LPL Financial.
Broken Window
Hurricane Ida caught the news, as it left millions of people without power in New Orleans only 16 years after Hurricane Katrina. Natural disasters are great tragedies, but ultimately, we will focus our discussion on the effect on the economy.
Let’s start with the broken window fallacy, penned by French Economist Frederick Bastiat. This fallacy disproves the myth that the destruction of property is beneficial to the economy. So in a situation where there’s destruction, we may not see a change in GDP, but we do have a society with less wealth. So, therefore, we don’t measure the economic activity that is unseen.
Natural Disasters
Source: Wall Street Journal
When we look at natural disasters, hurricanes are one of the most consistent and significant ticket items. However, we do have a property and casually for these disasters because they are tragedies. But let’s take this and compare it to the same scenario from Frederick Bastiat, the seen versus unseen.
When you look at the New Orleans economy, it’s going to look like it’s been stimulated by GDP because there is a transfer of money that has been sent to replace the infrastructure that Hurricane Ida has destroyed. So, this is the “seen” part. But what we won’t see is the money that the property and casualty companies would have used and saved for other investments to fund future catastrophes, where they would have to payout. So, therefore, we are not losing our spending as an economy but all the innovation that would have come from the property’s investments.
Storm Costs
Source: Wall Street Journal
Another thing that happens a lot whenever hurricanes come about is the severity of storms and that storms are getting worse. It is likely not the severity of the storms driving these costs up over time; we are developing areas in our communities.
So if, if we had a storm come through and it’s across the beach, and there’s no development whatsoever, we’re not going to account for all the different changes that happened in the environment because there was no economic component. So, therefore, as our economy continues to grow, the additional infrastructure increases.
Florida
So let’s analyze Florida because hurricanes are typically the most significant event that we see in Florida.
Source: Thirty Thousand Pages
We can look at the population growth for Florida and see 1960 Florida is not the same as present-day Florida. When we talk about the electoral college, Florida has a significant influence. It’s one of the most populated states in the country, but not the case in the 1960s. We can see that the population since the 1960s has increased. So you may be thinking the population increases everywhere, so why Florida?
Source: Thirty Thousand Pages
Well, we can see how the population influences Florida as the house of representatives increases over time. In 1944 they had six representatives; by ’64, they had 12, and in 2004 they had 25. This number is likely to go up with the number of people continuing to move to that state. But all the increase in population means that beaches that were empty before now have all kinds of infrastructure surrounding them. So whenever a hurricane comes through, there are more places to hit and what’s driving the increased costs.
Infrastructure Spending
Source: The White House
Infrastructure spending has been moving slowly, and there has been a lot of going back and forth with politics. Janet Yellen wanted to get the $3.25 trillion passed before the infrastructure bill, but the Senate has now approved an additional $550 billion in spending. The extra $550 billion is set to be voted on September 27th.
Although natural disasters come and go, our economy can take the hit for longer. Keep up to date with the effects of Hurricane Ida on our economy and more every Wednesday at 3:30 p.m. CT. And to learn more about this week’s Weekly Market Insights, be sure to listen to our recap video on our YouTube channel and SUBSCRIBE!
——
For detailed performance metrics, please don’t hesitate to contact your lead advisor. And, in the meantime, be sure to keep up to date on Gatewood Wealth Solutions through our daily 3x3s and our weekly market insights on our YouTube, LinkedIn, and Facebook accounts.
Disclosures:
Economic forecasts may not develop as predicted, and there can be no guarantee that strategies promoted will be successful. Therefore, the opinions voiced in this material are for general information only and are not intended to provide specific advice or recommendations for any individual.
All performance references are historical and are no guarantee of future results. In addition, all indices are unmanaged and may not be invested directly.
Securities and advisory services are offered through LPL Financial, a registered investment advisor, Member FINRA/SIPC. All investing involves risk, including possible loss of principal. No strategy assures success or protects against loss.
The opinions in this material do not necessarily reflect the views of LPL Financial.
Risky Business
The Delta variant-induced rise in Covid-19 cases is still capturing headlines, although we haven’t seen a significant increase in the number of deaths occurring. A few states have mandated masks with a potential lockdown, but this is mainly political. Nevertheless, if hesitation around the prevalence of the Delta variant persists, we would expect a significant impact on the market.
As we keep an eye on Covid-related market behavior, it’s also essential to evaluate market changes in the context of seasonality. Let’s dive in.
Significant Data Growth by Season
Nearly 300 out of the S&P 500 companies reported data on earnings this month. Eight-eight percent of those companies have beaten their revenue expectations, and 87% have exceeded their earnings expectations. So we have revenue growth of 23.1% and earnings per share at 85.2%, starting to explain why the market has been up.
Source: Nasdaq Dorsey Wright
Let’s examine each season more closely. We can immediately see the differences in appreciation of value, specifically in July. However, August, September, and October are historically rough months. For example, August’s maximum/minimum return is down 14% and up 7%. In contrast, October has the lowest minimum historical return of 21.76%. Therefore, we are getting into the months where we need to be more cautious.
Source: Goldman Sachs
The Goldman Sachs chart above shows how many days have gone by since the last 5% pullback in the S&P 500. Currently,184 trading days have passed since the previous 5% S&P 500 drawdown. This marks the 15th most prolonged period without a meaningful pullback and is significantly above the historical average of 97 days. However, historically speaking, we are due for a correction.
Variables Impacting the Market
Source: Gatewood Wealth Solutions
You’ve heard us mention that our GWS investment committee is becoming a little more cautionary in the market, especially heading into August, September, and October. The spider graphs above capture the reason why. In addition, these graphs reflect several vital points within the market that demonstrate the probability of having a market pullback, correction, or sell-off.
Money supply has been declining, and the yield curve is still positive, but it’s significantly lower than last month due to declining interest rates. Regarding the bullish percent index, few companies make highs relative to lows because consumer spending has been down. Lastly, housing and manufacturing are still positive, while transportation has remained constant.
Money Supply
In 2020, we saw a massive spike in money supply (green line). As a result, the annualized growth rate was about 60%. However, today’s money supply (red line) and the S&P 500 (dotted line), which historically are tracked together, are beginning to trend down, slowing the growth rate.
Then, when we look at the yield curve, we are beginning to see a decrease in growth. When a yield curve gets close to negative or almost zero, it is a significant indicator that the economy doesn’t have enough cash relative to all the projects they put in place when the money supply was growing before.
If we don’t have that correction in money supply, it could be detrimental to the market. We see the effects of high inflation in energy and food items especially. Energy is up to 10% annualized, where food and all other things are around 5%.
Source: U.S. Bureau of Labor Statistics
To learn more about how seasons affect market behavior, be sure to keep an eye out for our recap video on our YouTube channel and SUBSCRIBE!
——
For detailed performance metrics, please don’t hesitate to contact your lead advisor. And, in the meantime, be sure to keep up to date on Gatewood Wealth Solutions through our daily 3x3s and our weekly market insights on our YouTube, LinkedIn, and Facebook accounts.
Disclosures:
Economic forecasts may not develop as predicted, and there can be no guarantee that strategies promoted will be successful. Therefore, the opinions voiced in this material are for general information only and are not intended to provide specific advice or recommendations for any individual.
All performance references are historical and are no guarantee of future results. In addition, all indices are unmanaged and may not be invested directly.
Securities and advisory services are offered through LPL Financial, a registered investment advisor, Member FINRA/SIPC. All investing involves risk, including possible loss of principal. No strategy assures success or protects against loss.
The opinions in this material do not necessarily reflect the views of LPL Financial.
The Standard & Poor’s 500 Index is a capitalization weighted index of 500 stocks designed to measure performance of the broad domestic economy through changes in the aggregate market value of 500 stocks representing all major industries.
COVID 2.0
Here in St. Louis, politicians have been flip-flopping on the mask mandate in the county and city, now that the CDC has released new Covid-19 guidelines. Most notably, the organization recommends even vaccinated individuals wear masks indoors in public when in areas of high transmission due to the prevalence of the new delta variant.
Today, we will uncover what signals impact the market. So forget about all this political talk that you hear in the news and learn more about the data behind the action below.
Increase in COVID Cases
We’re now seeing a rise in COVID cases across the states. Louisiana has the highest daily average case rate in the United States, with the U.S. only having a 49% vaccination rate.
Then, if you look at the United States as a whole, you can see the behavior of the hotspots. For example, COVID cases show up in the Ozarks, move down to Springfield, cross into Arkansas and Louisiana, and Florida.
When you look closer at the Missouri hotspots, you’ll notice a slight uptick in deaths with a decent increase in hospitalizations. However, taking a closer look at the hotspots versus risk levels, you can infer the city of St. Louis is not one of the risky places. St. Louis is only number 77 out of 117 counties. Therefore, the overarching question is: is there a relationship between the number of people vaccinated versus the amount of Covid-19 cases?
Vaccinations
With most vaccines, the higher the percentage of vaccinated individuals, the less likely an outbreak will occur. But when we look at the numbers of Covid-19 vaccinations in each country, specifically Gibraltar, a region of the United Kingdom, you can see surging cases.
Gibraltar has a 116% vaccination rate, which may not be entirely accurate because data is not always clean. Canada is second to Gibraltar with a small number of cases. The United Kingdom is ranked third with a high rate of increased cases. Also, Sweden’s vaccination rate is higher than the U.S. but lower than the United Kingdom. Sweden has not seen a significant uptick and has zero deaths some days.
Professor Neil Ferguson, the controversial epidemiologist who predicted as many as 200,000 COVID cases a day in the U.K. if restrictions were lifted, is now facing scrutiny after infections continued to drop for the 6th day in a row. Again, this proves models don’t always reflect reality.
Per Capita Deaths
Every country got hit by the coronavirus differently. Still, because we have better therapeutics, even with increasing cases, it may not have the same impact on the market as it did in the past.
For a full deep dive into the second wave of COVID-19 and current market behavior, watch our recap video on our YouTube channel and SUBSCRIBE!
For detailed performance metrics, please don’t hesitate to contact your lead advisor.
And, in the meantime, be sure to keep up to date on Gatewood Wealth Solutions through our daily 3x3s and our weekly market insights on our YouTube, LinkedIn, and Facebook accounts.
——
Disclosures:
Economic forecasts set forth may not develop as predicted, and there can be no guarantee that strategies promoted will be successful. Therefore, the opinions voiced in this material are for general information only and are not intended to provide specific advice or recommendations for any individual.
All performance references are historical and are no guarantee of future results. In addition, all indices are unmanaged and may not be invested directly.
Securities and advisory services are offered through LPL Financial, a registered investment advisor, Member FINRA/SIPC. All investing involves risk, including possible loss of principal. No strategy assures success or protects against loss.
The opinions in this material do not necessarily reflect the views of LPL Financial.
What Is a Good Price-to-Earnings Ratio?
This week, the market spooked a bit following the potential rise of the Covid-19 Delta variant. In this post, we’ll quickly walk through short-term bond market behavior before diving more deeply into our main topic: understanding how to read a price-to-earnings ratio.
Starting with the technical side of things, you’ll notice the bond market showed a safety trade last week — likely from the Delta variant and expectations of a possible lockdown again. As a result, Treasury yields on the 10-year have gotten down to 1.13, which is very low.
This graph also reflects the scared, cyclical side of the equity market. You can see week after week, mid and small-cap values continue to move lower, while large-cap growth remains at the top.
In summary: after an initial drop in the market due to fear, we’re starting to see it rebound.
Price-to-Earnings Ratio
Now, on to our main topic for today: Understanding the price-to-earnings ratio. We’ll discuss what it is, why it’s valuable, and how to identify a fair price-to-earnings — or P/E — ratio. The P/E ratio is calculated by dividing the market value price per share by the company’s earnings per share.
Source: Investopedia
Since you’re dividing the price by earnings, the P/E ratio tells you exactly how many dollars you’re spending for each dollar of earning on the stock.
The main benefit of the price-to-earnings ratio is that it allows you to compare the prices of different stocks quickly and easily.
Now, let’s take this one step further. Research shows that stocks are worth the present value of the cash you could take out over the lifetime of the stock. So, just looking at the P/E ratio may not be enough. You also need to understand the stock’s cash flow behavior since, over the long-term, that’s what will drive stock performance. Finally, you must figure out a way to discount for the future value of those earnings.
How does that work? First, think of the valuation of cash flow for the S&P 500. When analysts calculate that valuation, they use both dividends and cash buybacks. So, you must project what both of those will be for your stocks to get your payout ratio. Then, you’ll divide that by your equity risk premium and a growth rate. How to Identify a Fair P/E Ratio
Let’s look at historical P/Es. In this chart, we see P/Es around the range of 16.5. Right now, we’re around 21.5. For reference, the average P/E for the S&P 500 has historically ranged from 13 to 15. To determine if a P/E ratio is fair, you should compare it to other stocks in the same industry, as well as relevant benchmarks.
We hear all the time from clients, “I don’t want to invest when P/Es are above average.” But if you’re afraid of high P/Es, you would only have had two chances to invest in the last five years: when the Fed tightened in 2018 and during Covid when P/E had fallen entirely, and the world was ending. If you didn’t invest during those times, you would have missed out on 22% returns in 2017, 30% in 2019, and 18% in the last two years.
Not only is it a bad strategy to assume, “High P/Es man we have to sell,” it also overlooks that high P/E can be an indicator that the market is thinking there’s going to be substantial growth in earnings. So, the reason you’re paying a higher P/E could be that analysts simply aren’t as bullish as the market.
What This Means for 2021
If we’re trying to set a price target for the end of the year, we need to look at where earnings will be. Then, to use a forward multiple, we need to see where our earnings will be at the end of next year. So, we use a consensus estimate (meaning an average of all analysts’ projections). The end of the year is about $191 on the S&P 500 in earnings. Looking out to the end of 2022, we see about a 12% growth rate to get $214 in earnings. So, we get a price objective target by the end of the year of 4,600.
This was a base scenario; let’s consider a bull and bear. In a bull scenario, we might say earnings grow at 15%, and the market does want to pay a higher multiple. Now, we’re starting to see a price target of $5,000, a 15% upside of where we are. In a bear market, we might see earnings coming down to 8% and pay a lower multiple with a downside of 10%.
For a full deep dive into P/E and current market behavior, be sure to watch our recap video below and on our YouTube channel. Of course, your GWS team is always available for questions, too!
——
For detailed performance metrics, please don’t hesitate to contact your lead advisor. And, in the meantime, be sure to keep up to date on Gatewood Wealth Solutions through our daily 3x3s and our weekly market insights on our YouTube, LinkedIn, and Facebook accounts.
Disclosures:
Economic forecasts set forth may not develop as predicted, and there can be no guarantee that strategies promoted will be successful. Therefore, the opinions voiced in this material are for general information only and are not intended to provide specific advice or recommendations for any individual.
All performance references are historical and are no guarantee of future results. In addition, all indices are unmanaged and may not be invested directly.
Securities and advisory services are offered through LPL Financial, a registered investment advisor, Member FINRA/SIPC. All investing involves risk, including possible loss of principal. No strategy assures success or protects against loss.
Taper Tantrum
With significant Consumer Price Index (CPI) increases over the last year, many are wondering: “Are index increases transitory?”
Over the last 12 months, all items on the CPI increased 5.4% before seasonal adjustment; this was the most significant 12-month increase since the period ending August 2008.
In reality, everything is transitory because, at some point, it will end. So the question is the duration of time. I think it’s fair to say this increase has lasted longer than what the Fed initially expected, but it doesn’t seem that they’re concerned.
For example, if we look at sales of used cars, you can see a 10.5% growth in June after a 7.3% and 10% growth before. And because the semi-conductor shortage curtailed the number of new cars being created, we see elevated prices in vehicles.
We haven’t seen this type of inflation for quite some time, but if you look at PPG, a supplier of paints, they would say inflation has not been transitory. PPG Industries Inc. repeatedly raises prices of the paint and coatings it sells to customers across industries as inflation in raw material and logistics costs pressures the $40 billion business. Looking back over the past year, we have also seen several home price increases.
Home Price Increases
The annual percentage of home prices in 2020 had a 12-14.5% price change on homes. But then, the monetary policy showed the spike coincided perfectly with the Feds stepping into the market and buying $40 billion per month of mortgage-backed securities. And to top it off, the Feds are still doing it despite a 14% increase. Therefore, the housing market is robust with the question of, “Are we in a housing bubble?”
We hear a lot of noise about house prices, but the biggest driver of home prices ultimately is per capita income. The more money you have, the more house you can afford — and the more you’re going to bid against other buyers. So, the significant long-term driver is the income you produce and the payments you can make to own a home. Just remember, if interest rates are low, the house’s value can appreciate.
Small Businesses Planning to Hire
Are small businesses planning to hire? Can they hire enough workers? The NFIB is a small business association helping understand what is happening from an economic standpoint. William Dunkelberg, NFIB Chief Economist, stated, “in June, we saw a record-high percentage of owners raising compensation to help attract needed employees, and job creation plans also remain at record highs. Owners are doing everything they can to get back to full, productive staff.”
If you look at the data above, we can see that more than 50% of small businesses have at least one unfilled opening at the moment, and 30% of the small companies are trying to hire. However, what stands out is we have more job openings and employees that quit relatively to unemployment. So for those who want a job, there are plenty out there.
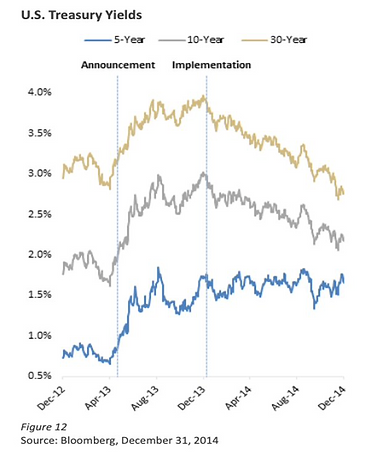
Taper Tantrum
On May 22nd, 2013, Federal Reserve Chair Ben Bernanke announced that the Fed would reduce the volume of its bond purchases.
We saw interest rates rapidly increase from his announcement, causing the media to coin the term “Taper Tantrum.” Unfortunately, because we had never seen this behavior before, there was no policy that we could look back at to see how the statistics would play out.
However, when the Fed began implementing the bond purchase strategy a few months later, you started to see yields decrease again. So the Feds are certainly keeping interest rates lower than they would have naturally, but we don’t believe their suggestions are that far off the natural pace.
This first taper represented a slowing of asset purchases, and it was what we would consider a proper taper. However, the second taper tantrum we’ll look at was much different. Under Federal Reserve Chair Janet Yellen, the Fed announced caps on the maximum number of Treasuries and Agency MBS allowed to roll off each month.
As a result, the Fed’s balance sheet shrunk, but the Fed continued to buy large amounts of treasuries. By signaling a gradual plan, the rates did increase but over a more extended period. Eventually, the rates decreased as the market better understood the implications.
Consumer Price Index (CPI)
The graph you see above — called the Consumer Price Index for All Urban Consumers: All Items (CPIAUCSL) — measures the average monthly change in the price for goods and services paid by urban consumers between any two periods. We had a considerable CPI number of 5.4%, causing yields to come down slightly, eventually rising. But then, July 13th was a growth day where we should have seen a value rotation. Also, the dollar increased relative to other currencies.
Overall, these statistics have been unusual. There has to be more to all of this than interest rates increasing. As the story unfolds, tune in to GWS’ YouTube Live every Wednesday at 3:30 p.m. CT for our take on what’s happening in the market.
——
For detailed performance metrics, please don’t hesitate to contact your lead advisor. And, in the meantime, be sure to keep up to date on Gatewood Wealth Solutions through our daily 3x3s and our weekly market insights on our YouTube, LinkedIn, and Facebook accounts.
Disclosures:
Economic forecasts set forth may not develop as predicted, and there can be no guarantee that strategies promoted will be successful.
The opinions voiced in this material are for general information only and are not intended to provide specific advice or recommendations for any individual.
All performance references are historical and are no guarantee of future results. In addition, all indices are unmanaged and may not be invested directly.
Securities and advisory services are offered through LPL Financial, a registered investment advisor, Member FINRA/SIPC.
All investing involves risk, including possible loss of principal. No strategy assures success or protects against loss.
Q2 2021: Follow the Data, Not the News
Executive Summary
You already know how important it is to us at Gatewood Wealth Solutions to serve as a trusted source of financial information on all things market- and economy-related. We want to signal through the noise to help you understand what’s worth paying attention to and what’s just media hype. But that’s no easy task when you’re finding yourself constantly bombarded with fear-inducing headlines and social media threads.
Recently, we heard one economist share that his mantra is, “Follow the data, not the news.” Of course, that resonated with us immediately, as it’s precisely what we strive to bring to our GWS clients and Weekly Market Insights listeners. The reality is that if you follow the news, it’s easy to become very fearful. Think about it — the news is in the business of selling advertisements. And one of the best ways to get you to sit through a commercial or an ad is to scare you just enough to listen. But, on the other hand, if you look at data, you gain a better sense of what’s happening in the market and make informed decisions based on those insights.
Speaking of digging into the data to find actionable insights, let’s dive into our key themes from Q2 of this year: inflation expectations, value/growth rotation, housing market boom, and supply chain blockages. We’ll start by looking at the market’s behavior as we wrap up this quarter.
Wrapping Up Q2 on a High
As of this writing, today is the last day of the month, and it looks like we’re going to end in a gain position with the market. This will be the fifth month this year so far. But are we at the top?
No one rings a bell when market performance peaks, so there’s no way to be sure. But we are following some fairly pervasive patterns. For example, take a look at the graph below, which shows the seasonality of the market.
As you can see, the chart above looks back over the last ten years at each month. We see how often the S&P is higher from when it began. A few observations:
January has been up 50% of the time over the last ten years.
If we frame April, May, and June as a quarter, that’s the best quarter based on seasonality.
July is up significantly; 89% of the time, the S&P has been positive for July.
Going back further, September and October are the months with the highest likelihood of a correction.
You might ask, “If we’re entering into July, will that impact the decisions we make since it tends to be a higher month — and then there’s a higher chance the market will be down?”
The answer is no because most of the time, in this scenario, we still have positive months. Fifty-six percent of the time over the last ten years, the S&P continued to move up and into positive territory during this period. This is known as technical analysis. We think there are economic reasons that corrections happen in October, but this doesn’t tell us if we’re due for one or not.
Next, let’s look at the volatility of the market. What’s the likelihood of a correction coming up?
Let’s start by considering the Volatility Index (VIX)— or what many people call the fear index. This measures options: calls and puts. What are calls and puts? A call option gives someone the right to buy a stock, and a put option gives them the right to sell it. A call is essentially a down payment for a future purchase.
As an example, let’s say Aaron owns AT&T when it is trading at $50. If he sells it to John at $55, and John pays $2 for the right to repurchase it at $55, John might repurchase it when the stock moves up to $60. The longer the option lasts, the more valuable it is.
Since April of 2020, the VIX has been trending down. However, the options in the market are trending in a way that doesn’t suggest a high probability of a correction at the moment. (Watch our Weekly Market Insights recap video for a full explanation of how we measure volatility.)
Theme 1: The Value/Growth Rotation
This quarter’s value/growth rotation has been somewhat of a teeter-totter: volatile on the edges but a calm constant in the middle.
For example, consider the graphs below showing how much the market was plus or minus 1% on a given date. Thus, 2021 looks somewhat average in terms of volatility, which might seem strange. But, there’s more to the story.
Now, let’s look at the edge of the teeter-totter: the ongoing value/growth rotation roller coaster. In the graphs below, we separate growth and value and look at how much they were plus or minus 1% on a given date. Again, you can see the charts look far more volatile.
For most of the year, especially the first part of the quarter, we’ve seen a value rotation in the market. As a result, we’ve made relevant changes to our portfolios, balancing those changes, of course, with tax impacts.
Theme 2: Inflation
Talk earlier this year of an additional $6 trillion in stimulus money sparked many discussions on inflation expectations. Now that those stimulus numbers have been reduced – and we see deflationary forces from technology and other areas – we don’t view inflation risk as high as it previously was. So we may see a bit of a reprieve on inflation going forward, which may also be the reason for the growth rotation mentioned above.
The Biden administration has the difficult task of making Manchin and Sinema happy while also trying to appease more centrist republicans like Romney when going after the filibuster. Currently, we believe the filibuster is too far away from markets and into politics for us to comment on.
Theme 3: Housing Market Boom
As the housing market continues to add fuel to its fire, many people have flashbacks in their minds to 2008 and wonder if another housing bubble is forming. The short answer is yes, it is developing — but it won’t pop now. There are four key reasons why:
First, inventory is the lowest it’s been in 20 years.
The stimulus bills increased liquidity. As a result, default rates are low, and the number of customers at risk of becoming delinquent is down 90%.
Bank lending requirements have changed since the aftermath of the 2008 financial bubble. The practices are much stricter, so it’s less likely to get out of control.
Millennials are aging and advancing their careers — so the demand for housing won’t abate any time soon.
Theme 4: Supply Chain Bottlenecks
Avid listeners of our Weekly Market Insights will recognize supply chain bottlenecks as a common topic over the last quarter. However, we are finally starting to see supply chains open up again, although there is still a significant shortage of truck drivers.
We had expected to see a declining dollar to reduce imports and increase exports — but that hasn’t happened yet. This is likely because consumers have shifted their expenditures to imports since the service economy was shut down.
For example, if they couldn’t go to dinner, a couple might have spent that $80 on clothing or another consumer good instead (products that are more likely to be manufactured in other countries; thus, imports). This increase the demand for shipping coming into American ports, but more miniature goods were leaving. This was causing issues in distribution and logistics. Especially for shipping containers, they arrived in the US but did not leave, meaning a global shortage in containers.
Now that the service sector is recovering, it will be interesting to keep an eye on the effect on imports, exports, and the dollar’s value.
Looking Forward
Looking outward at the rest of the year, we believe we are starting to see growth reassert itself.
We were concerned that if we didn’t break through this dome, we would start to dip. I’m happy to say the market wanted to go through that tactical dome, and there was more demand for stock positions (people seeking to buy) than the supply of stocks (people selling at current prices). Hence, stocks moved up at price because there is always an equal number of buyers as sellers.
What’s happening in the market has consolidated and is taking a breather. The longer it’s taking the break and trying to decide if it’s going to upside or downside, the greater the movement will be when it happens. So, we’re reading tea leaves here, but based on technical analysis, this tends to be a good indicator of how much price upside and downside risk we have.
Conclusion
When we start to think about the risk on the upside vs. downside, it’s a pretty favorable market at this point. Of course, there could always be a black swan event. But from a technician’s standpoint, we’re looking at a pretty decent risk/reward ratio when looking at the technical.
As we said, we’re following the data.
Speaking of data — we’re committed to bringing you our interpretation of market data every Wednesday on YouTube Live during our Weekly Market Insights broadcasts at 3:30 p.m. CT.
Be sure to subscribe to our YouTube channel and tune in each week to hear how we adapt clients’ portfolios and our investment thesis for the upcoming investment horizon. We’re here to help you make sure you’re doing the right things to preserve your wealth, which is part of our mission to help people become and remain financially self-reliant.
—–
Disclosures
Securities and advisory services are offered through LPL Financial, a Registered Investment Advisor, Member FINRA/SIPC.
The opinions expressed are those of John Gatewood as of the date stated on this material and are subject to change. There is no guarantee that any forecasts made will come to pass. This material does not constitute investment advice and is not intended to endorse any specific investment or security.
Please remember that all investments carry some level of risk, including the potential loss of principal invested. Indexes and/or benchmarks are unmanaged and cannot be invested in directly. Returns represent past performance, are not a guarantee of future performance and are not indicative of any specific investment. Diversification and strategic asset allocation do not assure profit or protect against loss. With fixed income securities and bonds, when interest rates rise, bond prices usually fall because an investor may earn a higher yield with another bond. Moreover, the longer the maturity of a bond the greater the risk. When interest rates are at low levels, there is a risk that a significant rise in interest rates can occur in a short period of time and cause losses to the market value of any bonds that you own. At maturity, the issuer of the bond is obligated to return the principal (original investment) to the investor. High-yield bonds present greater credit risk than bonds of higher quality. Bond investors should carefully consider risks such as interest rate risk, credit risk, liquidity risk, securities lending risk, repurchase and reverse repurchase transaction risk.
Investors should be aware of the risks of investments in foreign securities, particularly investments in securities of companies in developing nations. These include the risks of currency fluctuation of political and economic instability and of less well-developed government supervision and regulation of business and industry practices, as well as differences in accounting standards.
More of the Same Ahead
Inflation conversations came to a head June 15-16, when the Federal Open Market Committee met and announced the Fed’s new monetary policies. The meeting consisted of 12 individuals — mainly board governors and some representatives from local banks.
The committee target three essential topics during their meeting:
The committee decided to keep the target range for federal funds rate at 0-0.25 % until maximum employment.
Inflation has risen to 2%, and it is on track to moderately exceed 2% for some time.
The Fed will continue to increase its holdings of Treasury securities by at least $80 billion per month and agency mortgage-backed securities by at least $40 billion per month.
Even though we are above the target inflation rate, the graphs below show inflation well above 2% and trending down.
In addition, the Federal Reserve will continue to increase its holdings of Treasury securities and agency mortgage-backed securities until substantial progress has been made toward the committee’s maximum employment and price stability goals. These asset purchases help foster smooth market functioning and accommodative financial conditions, thereby supporting the flow of credit to households and businesses.
It’s also worth noting the dot plots below. Here, you can get a sense of the opinions of the 12 members of the Federal Open Market Committee. They believe the Fed will increase rates in 2023, and the central bank will hike at least twice that year. Only five members still see the Fed staying put through 2023, and seven of the 12 members see the Fed possibly increasing rates as early as 2022.
Indexes of the Market
Let’s look back 20 trading days at the different indexes of the market; we see NASDAQ (red), the 7-10 year treasury interest rate, the S&P 500 small-cap, copper, and gold (two bottom lines).
On June 16th, copper, gold, and the S&P 500 small-cap were already trending low, and they sold off going into and after the FOMC meeting.
Inflation at Risk
Inflation is undoubtedly a risk, but we’re trying to understand what the market is doing. We’re talking about possibly raising interest rates in two years if inflation is still high.
Going back to the beginning of the 21st century, we’ve been at a zero federal funds rate most of the time.
Federal funds rate
The interest rate banks charge each other to borrow or reserve extra funds overnight.
From 2008-2016, we slowly saw an increase — until 2020, when we went back down to zero. The Fed has historically kept these interest rates low over time, and we don’t believe that will change going forward.
So, let’s go back to inflation. You might expect inflation to be low over the time we’ve been at a 0% federal funds rate, but it has not necessarily been low. We see the 16% Trimmed-Mean Consumer Price Index (CPI) as a measure of core inflation calculated by the Federal Reserve Bank of Cleveland. The Trimmed-Mean CPI excludes the CPI components that show the most extreme monthly price changes. This series excludes 8% of the CPI components with the highest and lowest one-month price changes from each tail of the price-change distribution resulting in a 16% Trimmed-Mean Inflation Estimate.
Therefore, inflation is not necessarily shown in the data, and I don’t think the Fed will respond by raising interest rates. They’ve kept rates down to near 0-25 basis points, but the market responds as if this is a hawkish statement.
In conclusion, GWS believes that the inflation risk is undoubtedly high, but we don’t see a pause in inflation. Remember, high prices solve high prices, and we have seen commodities pullback before.
——
For detailed performance metrics, please don’t hesitate to contact your lead advisor. And, in the meantime, be sure to keep up to date on Gatewood Wealth Solutions through our daily 3x3s and our weekly market insights on our YouTube, LinkedIn, and Facebook accounts.
Disclosures:
Economic forecasts set fourth may not develop as predicited and there can be no guarantee that strategies promoted will be successful.
The opinions voiced in this material are for general information only and are not intended to provide specific advice or recommendations for any individual. All performance references are historical and are no guarantee of future results. All indices are unmanaged and may not be invested directly.
Securities and advisory services are offered through LPL Financial, a registered investment advisor, Member FINRA/SIPC.
All investing involves risk, including possible loss of principal. No strategy assures success or protects against loss.
Testimonials
"Our relationship with Gatewood Wealth Solutions has evolved over the years right along with our family. From building and protecting our wealth to retirement and estate planning, Gatewood has guided us and enabled our objectives. It’s assuring to know skilled professionals we trust are working with us to optimize what we have worked for all our lives. "
"My wife and I have had the benefit of working with John Gatewood for over thirty-five years. Initially, John worked with us planning our personal and business life insurance needs. As his service offerings expanded, we took advantage of his expertise to help us with our family's financial planning. We could not be more pleased than what we are with the plan the Gatewood Wealth Solutions team developed for us. The team members are well-trained, intelligent, friendly, enthusiastic, and very good listeners. We have two scheduled reviews of the plan every year with one of the principals and at least…"
"My wife and I have known and worked with John Gatewood and his team for nearly a decade. The values-driven team of Gatewood Wealth Solutions is motivated, caring, highly competent and personally fueled by character and integrity. I recommended Gatewood to friends and family - including my children - because their deep desire to help clients 'give purpose to their wealth' gives us all the opportunity to better serve our families and communities."
"Navigating the complexities of my corporate life was already a challenge, but when my husband passed away, it felt like an insurmountable mountain of emotions and paperwork. The team at Gatewood Wealth Solutions stepped in with compassion, efficiency, and expertise, guiding me through the entire estate settlement process. Their unwavering support made a world of difference during such a challenging time. I am profoundly grateful for all they've done and continue to do for me. Their services are truly unparalleled, and I wholeheartedly trust and recommend them."
"My wife and I became a client of Gatewood Wealth Solutions twelve years ago on the recommendation of a friend who was also a Gatewood client, and I am very glad that we did. Until that time, I had managed our 401(k) and investments, but with retirement on the horizon, we felt it important to get professional help for retirement planning and investment management. The Gatewood team developed an integrated financial and retirement plan that we refined together. It was based on information such as our current financial position, desired retirement date and lifestyle, anticipated job and retirement income, expenses,…"
"I have worked with Gatewood Wealth Solutions since its inception and could not speak more highly of my experience. Gatewood Wealth Solutions provides comprehensive wealth management services for my family in a very sophisticated way. Their planning services are comprehensive and consider all assets of our family, not just what they manage. This is important for our family since we have a real estate business which must be considered in our planning. They also help us with our estate and tax planning each year. Their service is exceptional and is proactive and not reactive. I have referred members of my…"
"I’ve been with Gatewood Wealth Solutions and its predecessor for 21 years as our financial advisors. I first met John Gatewood in 2002 when I purchased a life insurance policy from him when he was with Northwestern Mutual. Shortly after having additional discussions with John, we started using them as our only financial advisors. They continued over the years to more than perform above my expectations and also started to bring in additional talent within their organization in order expand and meet client’s expectations. Since they’ve organized as Gatewood Wealth Solution and separated from Northwestern Mutual, they’ve continued to add…"
"I have been with Gatewood Wealth Solution for seven years, and I would highly recommend them for wealth management services. They are a very efficient, effective, knowledgeable team that provides highly personalized, client-centered services. If I didn't know better, I would think that I am their only client! They have an excellent working relationship with a highly respected law firm that provides assistance with trusts and estate planning. They also have an excellent working relationship with a tax accounting firm. All of this so that all aspects of my financial planning needs are seamlessly coordinated. Their quarterly meetings are well…"
"Partnering with Gatewood Wealth Solutions has been one of the best decisions we have made in the last five years. I have met with numerous financial planners who’ve all come to me with similar ideas and recommendations that don’t seem to prove that they are thinking outside the box for me individually. But when Gatewood came to me with their plan it was strategically designed with so many aspects taken into consideration that I was surprised at how uniquely competent and professional they were. They brought me many ideas and recommendations that would not bring them profit. They brought me…"
"Gatewood Wealth Solutions gives me confidence that my retirement savings are being monitored and managed with MY best interest in mind. All of the staff is welcoming, friendly and respectful. They have comprehensive knowledge of long-term financial planning, estate planning and tax planning. I have been with Gatewood for many years and hope to be with them for many more years to come."
"I have known John Gatewood, the founder of Gatewood Wealth Solutions, for many years. We became friends well before we talked about business, and it was a natural decision to turn to John for help with our affairs when I needed it because I had grown to know and trust him. It really is true that John and his team at Gatewood Wealth Solutions are completely focused on helping ordinary families like ours to become financially independent. The family part especially means something: One day my 20-something son called to ask if I thought our group would be willing to…"
The statements provided are testimonials by clients of the financial professional. The clients listed have not been paid or received any other compensation for making these statements. As a result, the client does not receive any material incentives or benefits for providing the testimonial. These views may not be representative of the views of other clients and are not indicative of future performance or success.