Government Spending
Government Total Expenditures
The amount of government spending recently has been very high. We have two bills, infrastructure, and stimulus, being massive ticket items. During the 2008 crisis, everyone was agitated about the $1 trillion spent for the bailout. However, today we’re doing two $2 trillion bills. The government spending is undoubtedly high, and we’re starting to see that show up in the reports for companies.
Inflation Concerns
The graph below is looking at inflation concerns regarding earnings reports of companies and the correlation to inflation. When companies are giving their updates on goods, services, materials, labor, and the rest of their spending, it correlates with Consumer Price Index (CPI). We can see that it’s up 12%, which is enormous.
However, we see an uptick in the concerns by companies, and we can see the CPI correlates with consumer products. We’ve been as high as this before, and we did not go negative in the previous recession from lockdowns. So, we’re going off a higher base, and we’re already above-target inflation of 2%.
Who is Seeing Inflation First?
Producers see the inflation in the pricing first. Here is just a snippet of several reports from different companies that are talking about significant price increases as they produce the product:
FAST (Industrials): “We are experiencing significant material cost inflation, particularly for steel, fuel, and transportation costs.”
GIS (Staples): “Looking ahead, as we experienced a higher inflationary environment, our first line of defense will continue to be our strong holistic margin management cost-savings program. In addition, we are taking actions now and in the coming months […] to drive net
price realization that will benefit our FY2022. “
CAG (Staples): “we see input cost inflation accelerate in many of our categories and across the industry.”
LW (Staples): “while the pandemic-related effects on our supply chain were the primary drivers of our cost increases, we also realized higher costs due to input cost inflation in the low single-digits. We expect that rate will begin to tick up in the coming quarters as edible oil and transportation costs continue to increase.”
STZ (Staples): “similar to previous years, we’re expecting substantial inflation headwinds in the low to mid-single-digit increase range, largely related to glass and other packaging materials, raw materials, transportation, and labor costs in Mexico. “
PPG (Materials): “We experienced a significant acceleration of raw material and logistics cost inflation during the quarter. Coming into the year, we were expecting an inflationary environment and had prioritized selling price increases across all of our businesses. This has helped us achieve solid price increases year-to-date. With a higher inflation backdrop, we have already secured further selling price increases and are in the process of executing additional ones during the second quarter. “
DOV (Industrials): “What we are going to fight against between now and the end of the year […] is inflationary input costs between raw materials, labor, and price/cost. […] the way it’s looking, we may have to intervene on price again in certain of the businesses over the balance of the year.”
TEL (Tech): “I would expect our margins to modestly improve as we work our way forward here into the third and fourth quarter based on some of the actions that are underway and our ability to combat some of the inflationary pressures out there. […] Certainly, we’re feeling the biggest inflation right now is on the freight side. The freight inflation has been significant. And as we battled through there and there’s a variety of reasons for that, including higher air freight and so forth in terms of that. And that’s not unique to TE. Certainly, I think that’s been as well-publicized across the overall supply chain. […] labor cost is not a major issue on the inflation side, but labor availability in certain places that COVID is more impacting continues to drive some inefficiencies.”
These companies are discussing significant price increases as they produce their product due to supply and demand. If you look at the import price in the graph below, you can see a much higher spike than the CPI. The CPI is a blue line, and it is going parabolic. We also see it in the producer price index (PPI). As the companies push those out, then stock prices will continue to move up, which is a good thing.
Transitory – Short Term Components of Current Issues
What’s causing the current issues are transitory (short-term component) at the moment. If we look at just how many ships are trying to get into ports due to the back-order on goods, you will see how incredibly expensive a shopping container goes for. It comes down to the supply and demand component because many people have done without specific goods, and they’re trying to restock.
Although unemployment is high, we see a labor shortage in the lower wages across the board looking at the supply chain because it was disrupted due to the pandemic. Do we see this fixing itself over time? Yes, this is what we call transitory as supply-demand will come to a balance. However, we also have a monetary policy that is not transitory, which will be seen in food prices as they go up substantially.
There is also a discretionary component for the low and middle income, where if prices are going up on things they’re demanding, and they have to use more of their paycheck to purchase these items. Then, they will have less of their salary to pay for other things. Therefore, everyone’s inflation basket and experience are different. We can start to look at different groups on how inflation affects them differently. If we look at the bottom 10% (the median earner), we could see inflation is much higher than if we’re looking at the top 10% of earners.
Suppose it’s not a significant percentage, and everyone else has had to cut back elsewhere. In that case, the higher income will be able to spend money and go further because inflation is moving prices.
Biden’s Tax Plan
Political unrest will support calls for higher taxes on higher-income earners. This is not a phenomenon that just happened in 2020. It has been going on for quite some time. We’ve made the argument that it’s the federal reserve and their monetary policy that has benefited people with assets over those that make income.
The 1% and big divide between the different economic levels is something that’s been prolonged. Therefore, it is easier to propose higher tax increases. The current tax plan wants to raise the corporate tax rate from 21% to 28%, restore top individual rates from 37% to 39.6%, subject wages above $400,000 to social security payroll tax, and taxes on capital gains as ordinary income.
We’ve been able to “print” money, and there has not been the inflationary effect, so why raise the taxes? If Biden’s tax plan were to pass, this would not solve all the problems because it may not impact the number of government receipts coming in, and people change their behavior.
Also, there is a proposal to have the IRS donate $88 billion over the next ten years to make sure people are not gaming the tax system. Suppose you have to pay people to prevent any additional gaming of the system. In that case, that’s money that you’re not going to spend on the other government items, and it proves the point that when people are going to do a lot of things to prevent the tax from actually hitting right.
Although this is a higher than average tax increase, if we look at both of them together, it’s not the highest. Supporters and critics of President Biden’s tax plan have made various claims about the size of the tax proposals, ranging from “not big enough” to the “biggest tax increase in history,” however it can be both.
By comparison to these past tax increases, in the first year, Biden’s tax plan would increase federal revenue by 0.68% GDP, making it the tenth-largest tax increase since the 1940s. In the second year of Biden’s plan, when the temporary expansion of the Child Tax Credit expires, the plan would increase federal revenue by 1.52% GDP, tying for the fourth-largest tax increase as a share of GDP since the 1940s.
In addition, Biden’s proposal would raise significant revenue. The plan would also have a negative long-run effect on the American economy, lowering long-run output and after-tax incomes.
If we look at the tax foundation table above, they assume GDP will drop 1.62% on our future growth. Our capital stock will decrease, and it’s the capital that allows for wage increases long-term. The more efficient your tools are that make you more productive; the more you can sell, and the higher wages you can pay.
Then, we would see a wage rate drop because of the tax increase. It’s not just the wealthy that are going to feel this. The rich create businesses and spend a lot of the money to affect the people they hire if they have less of that. Then, it would cause an estimated half-million lost jobs due to tax increases.
Tax Revenue
Now, let’s talk about tax revenue as a way to close the gap. We can change the way taxes are received, but that’s not the problem. The problem is the amount of government spending. The graph to the left shows you the volatility and the growth rate compared to revenue. Revenue is relatively steady, and it continues to move up.
The graph on the right shows the revenue and stability (the green line) versus the spending. The spending is growing, and at the bottom, you can see the deficit. Therefore, it’s the government spending that is causing a lot of the problems. So, if we want to make a significant impact on the deficit, the bigger thing to focus on at the moment is government spends.
Keep up to date on Gatewood Wealth Solutions through our daily 3x3s and our weekly market insights on our YouTube, LinkedIn, and Facebook accounts.
Economic forecasts set forth may not develop as predicted and there can be no guarantee that strategies promoted will be successful.
This information is not intended to be a substitute for specific indivudalized tax advice. We suggest that you discuss your specific tax issues with a qualified tax advisor.
All investing involves risk, including the possible loss of principal. No strategy assures success or protects against loss. There is no guarantee that a diversified portfolio will enhance overall returns or outperform a non-diversified portfolio. Diversification does not protect against market risk.
The opinions voiced in this material are for general information only and are not intended to provide specific advice or recommendations for any individual. All performance referenced is historical and is no guarantee of future results. All indices are unmanaged and may not be invested directly.
Securities and advisory services are offered through LPL Financial, a registered investment advisor, Member FINRA/SIPC.
Demographics and Destiny
Demographics and Destiny
Demographics is destiny, not density. This map shows how many more people live in other countries compared to our own. We can see China and India are the densest and most populated countries.
To understand how this affects the economy, we need to go back to the Keynesian model. It shows Gross Domestic Product (GDP) equals consumption plus investment plus government spending, and exports and imports will have some effect. The two things that matter the most are consumption and investment choices. Everyone is constantly consuming things, but some have different ratios on consumption versus investment.
GDP = C + I + G + (X – M)
(Consumption and Investment)
Senior Population
If you look at the senior population, frequently industrialized and developed nations have significant savings from the previous production. When we think about them as only consumers, it’s a lowercase c. Why? Because many people call them “annoyingly wise” with their consumption. In other words, they have to be much wiser on how they consume. We would consider this lifestyle bucket to have many savings if it’s an industrialized country, but there are low consumers in the GDP model.
Producer Population
Now, if we look at the producer population, they will be consumers while being significant producers. Goods that are coming into the economy will be produced by the age group of 18-65. Their choices between consuming versus investing will be highly related to how many people are dependent upon them.
Suppose you look back to the senior population, and they don’t have savings to live off of. In that case, they’re going to put a drag on the producer population because their consumption versus investment choices are different. Meaning they may have a parent to be supported. This leads to less money for investment causing GDP to grow more dramatically. Therefore, the lower the senior population dependency on the producer population, the faster the GDP can grow.
Borrowing Population
Then there’s the borrowing population. This population is no longer in childhood, and they are getting educations, starting families, or starting their first job. They are not big producers yet, but they have a lot of demand for borrowing because they’re investing in future production. They have a symbiotic relationship with the senior population because they can loan to this group as they develop their skills.
Child Population
The child population is a significant factor in the producer population regarding consumption. If you don’t have many kids, you tend to have more investment in other things in your life. Therefore, children will be a big part of the producer’s consumption versus investment choices. Just because children are mainly only consumed does not mean that’s a drawback because they’re detrimental to long-term growth. Remember, they’re the future producers as well.
Expanding Population
The population pyramid above is an expanding population often relating to an expanding economy with the age bands on the left. Then, you have it divided by how many people are male or female. For productivity of making more children, the ratio of women is far more critical than the number of men. It’s the norm of the population, when the more women you have, the higher the fertility rate. The ratio of men to women will have different economic impacts, like China has fewer women than men because of their prior one-child policy.
If you look at the pyramid, we can see that the segment comprises mainly young people. The further we go up the less impact that has. This is met with good capital structure and technology and could be a booming economy in the next 20 to 30 years.
Stationary Population
Here is a stationary population. We see the children and the producing population are pretty steady. However, there is a little bit of a decrease here, but you can easily make that up with immigration. We can see that this will be just a stationary economy with no significant liability for demographics in the future.
Population Dividend
Next, we have the population dividend. If you get an example where the fertility rate is low in a country with not many children or elderly for the producer population to support, then the choices on consumption versus investment change. All the excess money is going into the growing the economy faster, which is a massive boon for the economy. The population dividend turns into a population liability.
Population Liability
As individuals retire, there’s a decreasing amount of people that are producing within the economy. If there were plenty of savings that the senior population has to live off during production, then there will be more imports coming in to support them as they decrease spending.
Demographic Comparisons
What are the four countries we have been talking about? The first one expanding is Mexico, with a very young population that is multiplying. The next one, the United States, is right next door to Mexico, where the immigration is coming from the Southern border. The current population dividend is China, and they do not have a lot of savings for their senior and the current producer population. They are becoming wealthier, but not fast. Lastly, we have Japan for population liability. Japan in the eighties-nineties was taking over the world because they were in a population dividend.
Japan and China Comparison
China has a 20-year lag to Japan. Japan was in the expanding phase through the sixties to seventies. Then, they started to move into the producer population. By the eighties to the nineties, they were reaching the population dividend. Then, 2000 happened, and things began to turn, and the economy not growing much since.
Production Function: Growth Rate of GDP Overtime
(Current Capital Stock, Technology Development, and Labor Population)
The growth rate of GDP over time has a couple of more factors with a fairly complex equation, but we can keep it simple as:
-
Do you have a current capital structure?
-
Do you have factories and tools that are already there in the economy?
-
Are they good at developing that capital structure further?
These three components are the primary factors on how fast an economy is going to grow over time.
Keep up to date on Gatewood Wealth Solutions through our daily 3x3s and our weekly market insights on our YouTube, LinkedIn, and Facebook accounts.
All investing involves risk, including the possible loss of principal. No strategy assures success or protects against loss. There is no guarantee that a diversified portfolio will enhance overall returns or outperform a non-diversified portfolio. Diversification does not protect against market risk.
The opinions voiced in this material are for general information only and are not intended to provide specific advice or recommendations for any individual. All performance referenced is historical and is no guarantee of future results. All indices are unmanaged and may not be invested into directly.
Securities and advisory services are offered through LPL Financial, a registered investment advisor, Member FINRA/SIPC.
Market Bubble
Market Bubble?
When we’re thinking about the market, one thing that is on our minds is the market in a bubble? You turn on your TV and, you often get an oversimplified definition: priced earnings P/Es are high, sell your stocks. This is on people’s minds because they see previous valuations in 2000 and 2008. So, it is a fair statement to say valuations are stretched.
Price to Earnings Ratio
The price of the S&P 500 divided by its trailing earnings gives you the price-to-earnings ratio. You can use all sorts of measures for price-earnings, such as trailing or forward. Specifically, we’re using a high standard here.
The graph looks at the last 12 months of earnings and shows how much you pay per dollar of earnings. This is how you can value stock, and you don’t have to worry about inflation. When earnings increase, the value of stocks should, too. Therefore, a relative valutation of price to earnings is a great way to compare stocks prices over time.
What is the Alternative?
The alternative in the year 2000 and 2008 were bonds. If you would have sold in the 2000 timeframe, the ten-year was paying over 5.5%, and inflation was reasonably low, especially during the recession. However, today we don’t have higher yields in the bond market. We’re at 1.74%, and inflation expectations are running at 3.3%. Not only is the interest rate low, but inflation is above what that interest rate is paying.
We wanted to put numbers to the story, so here is a more straightforward way of looking at it.
We are showing 33, as the highest P/E- S&P 500, looking at the past 12 months where we know there were some rough patches. The average for stocks is about 2x higher and 3x higher on the average of bonds. Therefore, bonds could be more overvalued than stocks based on historical standards. The only way to improve the P/E ratio on a bond is to have the price decrease. For stocks, the P/E ratios can improve via a drop in stock price, our fear or by earnings moving up, our hope. Earnings moving up is what we expect for stocks currently.
Earnings Season
As we enter earnings season, the expectations for earnings are high. We’re likely to see “record-breaking” numbers because we’re looking back 12 months ago. There were low to no earnings coming in due to the global pandemic.
Just as we compared bonds to stocks using a P/E multiple, we can easily compare stocks to bonds via a normal valuation for bonds by converting both to a yield. The Fed model above compares the earnings yield of stocks to the earnings yield of a bond. Whenever one is over the other, that’s the undervalued asset class, and you should invest. If we go back to the sixties, you should have been buying stocks, not bonds, based on the earnings yield. Then, to the eighties, we can see both lines matched up together. As interest rates decreased on bonds, stocks looked more attractive and were also bid up at the same rate. We can see the red line (stocks) is over the blue line (bonds) right now. Once again, not just looking at the P/E, but looking at the earnings yield, we can see stocks are more attractive versus bonds looking at the overall investment opportunity set.
Fixed Income Market Dynamics
The interest rate is the downside risk of bonds. At 1.74% on the 10-year, we’re having one of the worst starts over the last 40 years for bonds. Just another 1%, and we would see further decreases of 7-9% in the ten-year treasury. So there’s undoubtedly some downside risk in bonds.
Government spending can cause interest rates to increase because there’s only so much money that can be invested. The way that the U.S. has been offsetting a significant steep increase is by printing money, but that can cause inflation expectations, which can also cause interest rates to move up.
Ultimately, I think the risk for fixed-income is the long-term risk of inflation. Especially at low-interest rates, because if interest rates increase and you see the drop in your treasury, over time, it’s just going to appreciate at the higher interest rate and give you back all the cash you expect.
There’s never going to be any more upside to the bond from when you bought it. So if we had a $1000 bond and it pays us 1% while holding it for 20 years, you will get about $1,200 at the end. $1,200 is more than $1000, but what about that purchasing price in $1,200?
In the cost of basket goods, assume the basket today costs $100. We’re going to inflate it by 2%, 4%, and 6%.
The bond appreciated 20% at a 2% inflation, so the $100 basket of goods cost you $150. Now at 4%, it’s more than double at over $200 in 20 years. It is unusual to see 6% inflation over 20 years, but if you did, it would be over $300. Another way to think about this is to compare the bonds to the cost of goods. In other words, what is the effect of my purchasing power on that basket of goods, assuming that I’ve invested and I’m earning 1% and I’m losing 2%, 4%, or 6%.
In the 2%, you’re losing 1% to inflation each year. At 4%, you’re losing 3%, which has historically been the expected norm for inflation. Then, at 6%, you’re losing over half to inflation each year.
The income that you’re going to get on the bonds will be taxed. Typically you buy bonds where there is some cost or investment management fees. It’s not beyond the realm of possibility to be somewhere between 3-5%, especially since 3% has been the historical norm on the loss of purchasing power. We have a mission to help clients become financially self-reliant, and bonds will not fill that role. Gatewood Wealth Solutions doesn’t see bonds playing a role in preserving purchasing power and wealth at the current low interst rates.
Keep up to date on Gatewood Wealth Solutions through our daily 3x3s and our weekly market insights on our YouTube, LinkedIn, and Facebook accounts.
The opinions voiced in this material are for general information only and are not intended to provide specific advice or recommendations for any individual. All performance referenced is historical and is no guarantee of future results.
All indices are unmanaged and may not be invested directly. The economic forecasts outlined in this material may not develop as predicted, and there can be no guarantee that the strategies promoted will be successful.
All investing involves risk, including the possible loss of principal. No strategy assures success or protects against loss.
Securities and advisory services are offered through LPL Financial, a registered investment advisor, Member FINRA/SIPC.
Bonds are subject to market and interest rate risk if sold prior to maturity. Bond values will decline as interest rates rise, and bonds are subject to availability and change in price.
Q1 Recap
COVID-19
The global pandemic was a central theme this quarter; going back to the beginning of the year, we can see that there’s been a significant drop in the number of cases, which has helped in the reopening. There’s also the optimism of the COVID vaccine, whether it’s Pfizer, Moderna, or Johnson & Johnson.
As the susceptible population drops, the severity of the outbreaks decline. There is a possible third wave in early Spring, but not as severe as more medical intervention options become available.
Change in Leadership
One theme that also dominated market trends in the first quarter – just as it did in Washington D.C. was a change in leadership leading to government spending and tax changes. President Joe Biden was announced as the 46th President of the United States on January 20, 2021.
President Biden called for returning the top marginal rate to 39.6%, the same rate when President George W. Bush, a Republican, was in office. The 2017 tax cut reduced that rate to 37%. Under Biden’s campaign tax proposal, those annually earning more than $1 million would have to pay higher taxes on capital gains, which typically make up the largest share of income for the wealthy. He would require estates to pay taxes on the unrealized gains on these assets.
As part of his campaign platform, Biden wanted to subject wages of more than $400,000 to Social Security payroll tax, currently capped at $142,800 for 2021. Ultimately he would rewind the estate tax policy to 2009 when the federal exemption was $3.5 million per person, and the rate was 45%. Biden would also reverse part of the 2017 tax cuts to the corporate income tax rate. He would increase it to 28%, up from the current 21%, but not as high as the 35% top rate before the Republican tax breaks.
As tax proposals change, government spending does as well. Biden proposed a $2 trillion bill on infrastructure and jobs. The plan includes everything from road repairs and electric vehicle stations to public school upgrades and training for the clean-energy workforce.
U.S. Deficit Spending is Accelerating the National Debt
Because the infrastructure bill is so high, it will impact the national debt vs. Gross Domestic Product (GDP). All of the Government spendings are starting to show up in statistics and is a concern. The blue line is the national debt. It has continued to increase over the last year. If you look at GDP, the red line, you can see that the debt is outpacing GDP by far. These numbers and the relationship between one another are essential to pay attention to due to inflation.
Inflation Fears
We know the inflation fears exist because people are no longer saying that we won’t have inflation, and we already see the signs of inflation in the graphs below.
The left graph represents the first quarter of 2021 and looks at several U.S. stock market indexes vs. several commodity indexes. Commodities for the quarter have significantly outpaced the stock market indexes. We can also see a similar trend where everything is based on the Dow Jones Industrial Average. The NASDAQ was up more than 9% above the Dow. However, it was nothing compared to the energy index, which was up 20% over the Dow.
Crowding Out Effect
The Government is pulling resources by spending and increasing prices by bidding up, known as Cost Pull. They then decide what investments to make and taxing corporations that reduce their ability to invest in growth (reducing long-term private-sector production). It is not just in the price of things; we see it in the bond market as well.
Inflation Expectations
We see inflation expectations in rising yields between 3-3.2%. Inflation is not something that the government isn’t aware of. It’s something that they are pursuing as a policy, another theme we see in the 1st quarter.
Bond Indexes
For bonds, the first quarter of 2021 was at its worst in over 40 years. The bond sell-off hit treasuries the hardest, followed by safer core and corporate bonds. Only high-yield bonds managed to end the quarter in positive territory.
Equity
Perhaps the most notable change was strength in value stocks, which have been lagging significantly in recent years. Still, the longer-term performance gaps are in favor of growth stock. Long duration is not just a concept in fixed income; it’s a concept in stocks. Stocks that are long duration tend to be growth or technology.
In the Image above we can see the long duration effect on returns. Changes in the discount rate will have a larger impact on Growth than Value and Large cap compared to small cap. There are always other factors to consider, but this showed up for the first quarter. US Large Cap Growth was negative .73%, while Large Value was a strong 10.13%. Small Value was 21.41% while, Small Growth was negative .42%. For the first quarter, the further down market cap and to the value side, the better the performance. This is not the case over the 1 and 3 year time periods. Over the last year, you wanted to be Small with a Growth tilt and over 3 years Large with a Growth tilt. Is this the start of a new rotation away from Growth stocks? This has yet to be determined.
The broadening of recovery and rising interest rates boosted cyclical stock sectors during the quarter. Energy stocks gained 31%, and financial services and basic material companies led all other sectors. Defensive sectors suffered, and technology stocks gained the least of any sector for the first time since 2016.
Keep up to date on Gatewood Wealth Solutions through our daily 3x3s and our weekly market insights on our YouTube, LinkedIn, and Facebook accounts.
The opinions voiced in this material are for general information only and are not intended to provide specific advice or recommendations for any individual. All performance referenced is historical and is no guarantee of future results.
All indices are unmanaged and may not be invested directly. The economic forecasts outlined in this material may not develop as predicted, and there can be no guarantee that the strategies promoted will be successful.
All investing involves risk, including the possible loss of principal. No strategy assures success or protects against loss.
Securities and advisory services are offered through LPL Financial, a registered investment advisor, Member FINRA/SIPC.
Semantics of Inflation
COVID-19
In New Jersey, the COVID-19 case count is beginning to increase again. However, if you look at Texas, you don’t see anything. If news stations or individuals discuss science, they should have a working theory on how science happens.
If you were to compare New Jersey and Texas, New Jersey is right on the dot. Remember the Sun Belt states? It was predicted cases would increase based on season changes by the end of March and April 2021. This is where people go into air-conditioned environments, making it a better environment for the Corona Virus to spread. Texas will likely have a bump in June. With that being said, we only need about 60 to 70% immunity, and as more people get the vaccine, the closer to exemption we become.
What is Inflation?
From our vantage point, inflation is when we see goods increasing in price, or another way to say it is the dollar is decreasing in value. Remember, it’s not the goods that are changing. It’s the currency. Therefore, we’re inflating the money supply, which is historically the definition for inflation. Rising costs are symptoms of inflation. I think people have pushed back on the idea of inflating the money supply because there are times whenever you don’t see goods go up if you measure it by price. From our experience, there has been a significant increase in the money supply over the last decade.
Inflation Equations
Here is an equation by Milton Friedman, who said inflation is always and everywhere a monetary phenomenon.
Money (M) is the water, velocity (V) is the pipes or how everything rotates, everything in the whole (Y) is the production of tangible goods, and the pressure (P) is the gauges in the pipes or the price of items.
There is a central pipe, the banking system, including the federal reserve and the treasury on how money gets into the system. The way that it gets through the economy is not just through one single pipe. You have lumber, home building, food, car manufacturing, semi-conductors, and many other ways to get through the economy.
When you increase the money supply, everyone has their different rank order goods, and they’re competing with each other. The areas that they have are where the highest demand is going to be. The areas that tend to get the flow are usually capital markets because most of your money is already going through things you need. Then, when you get a substantial increase, the majority goes into investing. So, once you have all your food, shelter, and clothing, additional money starts to flow in a capital market, and that’s why home prices and investments have gone up.
Moore’s Law
One thing that continues to keep prices down is this notion of Moore’s law: the amount of transistors you can put on a microchip has increased every 18 months. But the way that you understand that diminishing returns has to happen as you take the absurdity is you flip it.
Another way of understanding that would be that you’re making the transistor smaller and smaller. The smallest transistor would be a size of an atom, and the chip would be about Venice’s size. At some point, you’re going to run into problems. The diminishing returns of putting more transistors on that chip interest will slow down, which means those deflationary forces through technology start to let price inflation come back into this system.
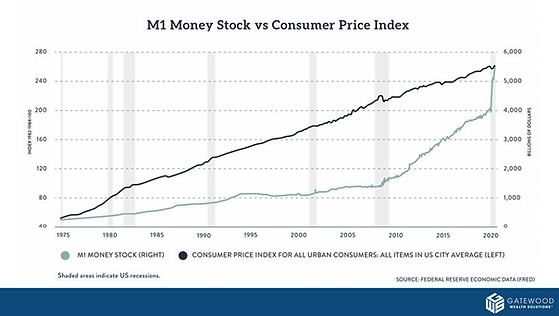
M1 Money Stock vs. Consumer Price Index (CPI)
Going back to 1975, the CPI has been climbing at the same slope. Money supply, all the way through 2008, was growing at a slower rate than inflation. The amount of money that was being created wasn’t causing the prices to go up less, but rather to go up faster. In 2008 we saw a rapid expansion in the money supply, but CPI stayed the same. Now the money supply is exceeding it, so it isn’t a one-for-one.
Asset Prices or Debt
One of the places that the rapid expansion has been going is asset prices or debt. In 1960, we had 53% of our Debt to Gross Domestic Product (GDP). We were holding 53% of our economy, our national income as debt. It went down in the 1980s to 34% because the government was inflating through the sixties and seventies. Then, by 2000 we were at 58%, moving up to 130% now. Our debt is growing at a lot faster rate than our economy, and it is our economy that pays it back.
Inflationary Outcomes
What are the ultimate outcomes whenever you inflate the money supply?
-
Interest rates increase above a point that velocity slows—market crash due to restructuring the economy towards consumer goods and away from capital goods.
-
Servicing the debt becomes impossible, and the liquidation of debt through default and restructuring—market crash does a sharp drop in money supply
Continue to Monetize the Debt with Eventual Price Inflation
-
A loss in the faith of the currency–hyperinflation
-
Weimar Republic, Venezuela, Zimbabwe, Continental
-
Greyback versus Green Back
Inflation Expectations
Interest rates are beginning to rise with inflation expectations, but equities are doing better than bonds for the year. The inflation expectations are now over 3% in the bond market.
It is undoubtedly true that if we look at how bonds have started the year out, this is one of the worst starts in some time for bonds. You have to remember that even though interest rates are going up, if you get a brand new bond, that might be good, but it’s the current bonds you hold that the price will go.
Keep up to date on Gatewood Wealth Solutions through our daily 3x3s and our weekly market insights on our YouTube, LinkedIn, and Facebook accounts.
The opinions voiced in this material are for general information only and are not intended to provide specific advice or recommendations for any individual. All performance referenced is historical and is no guarantee of future results.
All indices are unmanaged and may not be invested directly. The economic forecasts outlined in this material may not develop as predicted, and there can be no guarantee that the strategies promoted will be successful.
All investing involves risk, including the possible loss of principal. No strategy assures success or protects against loss.
Securities and advisory services are offered through LPL Financial, a registered investment advisor, Member FINRA/SIPC.
Brave New World
How and When Should I Invest my Excess Cash?
A popular reason clients come to us is that they have a large amount of cash — and want to make sure they’re investing it at a good time. Maybe they had a significant liquidity event, sold their company, exercised their stock options, were paid a large bonus, or even received an inheritance. The first question on clients’ minds is nearly always, “When and how should I invest the cash into the market?”
When people find themselves with excess cash on their hands, it can be challenging to know whether to invest now or hold the cash for a more suitable time. Part of that dilemma is psychological. It’s hard to let go of a massive amount of money and simply trust the market with it. And while it’s generally a good idea to invest all excess cash outside of someone’s cash target, there are still options for clients who aren’t comfortable doing so right away.
It comes down to whether someone is an emotional or rational investor. Neither approach is “right” or “wrong,” and we offer paths for both preferences.
What do I mean by that? Watch the video below to hear our CIO Aaron Tuttle, CFA, CFP®, CLU®, ChFC® and I explain the difference between emotional and rational investing, as well as how we can work with either preference to get your cash invested properly.
Keep up to date on Gatewood Wealth Solutions through our daily 3x3s and our weekly market insights on our YouTube,Facebook, and LinkedIn accounts.
The opinions voiced in this material are for general information only and are not intended to provide specific advice or recommendations for any individual. All performance referenced is historical and is no guarantee of future results.
All indices are unmanaged and may not be invested directly. The economic forecasts outlined in this material may not develop as predicted, and there can be no guarantee that the strategies promoted will be successful.
All investing involves risk, including the possible loss of principal. No strategy assures success or protects against loss.
Securities and advisory services are offered through LPL Financial, a registered investment advisor, Member FINRA/SIPC.
No strategy assures success or protects against loss. Investing involves risks including possible loss of principal.
Black Swans or Grey Elephants?
Air Travel Hitting an All-Time High in the Past Year
The United States has air travel picking back up, hitting the highest level in a year amid eased restrictions. An increase in air travel is very much good news, but it’s going back to that reopening theme and some inflation fears that a lot of people have as we come out of the lockdowns and recession.
Stimulus
For those receiving checks, check your account. If you have not done so already, it should be there. As most of you already know, we had the new stimulus bill (STEMI) passed last week and signed into law by president Biden. However, it has its detractor, and the most vocal regarding the STEMI is Senator Rand Paul. He followed in his father’s footsteps in the Austrian business cycle theory (the philosophy of how economies work). The detractors are about the business cycle caused by monetary policy through central banks. Usually, this does not end well if you continue to grow the economy by just throwing money into the system.
In the quote above, Senator Rand Paul was quoting the non-partisan CBO. He mentions the increase in risk for the financial or fiscal crisis, and in this situation, it could lower confidence in the U.S.’s ability to pay down debt. What he said should cause all the politicians to have some sort of pause.
Diving deeper into that CBO report, they said the reserve status of the U.S. currency is undoubtedly at risk with the amount of spending. By 2050 the amount of revenue that the government is giving, 50% of it needs to go to just pay the interest.
Infrastructure Bill
President Biden is not the first president to say we need to do infrastructure spending. President Trump campaigned on an infrastructure bill. President Obama campaigned on an infrastructure bill. However, we continue not to spend money there. The Government is talking about a $2-4 trillion stimulus bill for infrastructure after the U.S. has already spent $6 trillion in stimulus over the last year.
The administration has also stated that this infrastructure bill should have higher interest rates. So, Treasury Secretary Janet Yellen talks about the need to do this infrastructure and points out the need to fund the higher tax infrastructure bill.
The Biggest Federal Tax Hike Since 1993?
The administration is embarking on what could be the most significant federal tax hike since 1993 to finance an infrastructure plan, Biden’s climate-change initiatives, health care, and economic inequality. Bloomberg has a list of reportedly under consideration proposals, though they all likely won’t make it into the final bill. Notably, the first two bullets would effectively unwind the two most significant Trump tax cuts components.
-
Raising the corporate tax rate to 28% from 21%.
-
Paring back tax preferences for so-called pass-through businesses, such as limited liability companies or partnerships.
-
Raising the income tax rate on individuals earning more than $400,000.
-
Expanding the estate tax’s reach.
-
A higher capital-gains tax rate for individuals earning at least $1 million annually. (Biden on the campaign trail proposed applying income-tax rates, which would be higher).
With all the talk about a federal ‘wealth tax,’ progressives in certain parts of the country are already pushing for state wealth taxes in places like New York – the notion that taxes will move higher under Biden is hardly a surprise.
Just as the Laffer curve results do not square with the image above, why bother with taxes if the infrastructure bill pays for itself? Our view is the monetization of the debt. The political risk of raising taxes will likely keep rates low.
Why bother with taxes at all?
Jeffery Gundlach, an American investor, and businessman states, “80% of the budget is borrowing, so why bother with taxes at all. In other words, he talked about the unlikeliness of taxes increasing substantially.
If you look at what has happened over the last year, 80% of the spending has been met with borrowing or stimulus through the federal reserve. Therefore, our take is that we probably don’t see a massive change in tax policy.
Unknown and Known
The amount of money going into the system is making the deflation argument less impactful. This is something that we know, and there’s plenty of unknowns. We titled this market insights call “Black Swans and Gray Elephants” because there are things that we do know but just not getting a lot of coverage, such as:
Keep up to date on Gatewood Wealth Solutions through our daily 3x3s and our weekly market insights on our YouTube,Facebook, and LinkedIn accounts.
The opinions voiced in this material are for general information only and are not intended to provide specific advice or recommendations for any individual. All performance referenced is historical and is no guarantee of future results.
All indices are unmanaged and may not be invested directly. The economic forecasts outlined in this material may not develop as predicted, and there can be no guarantee that the strategies promoted will be successful.
All investing involves risk, including the possible loss of principal. No strategy assures success or protects against loss.
Securities and advisory services are offered through LPL Financial, a registered investment advisor, Member FINRA/SIPC.
Bonds, Rates & Rotation
$1.9 Trillion Stimulus Bill and $3 Trillion Infrastructure Bill
There has been a lot of noise coming from Washington D.C. regarding the $1.9 trillion stimulus package. It has passed the house and went to the Senate. The Senate then removed the $15 minimum wage due to the parliamentarian rule. Therefore, it is now going back to the house to be approved. Likely by March 12, 2021, President Biden will sign it into law.
The next big package is going to be the infrastructure bill. The current administration anticipates having a proposal out this month; however, it seems that there’s not as much enthusiasm to get another $3 trillion infrastructure spend. However, both Republicans and Democrats are for this bill.
The Recovery and Spending is Putting Upward Pressure on Bonds
The federal government’s amount of money that they are creating and borrowing increases on the curve’s long end. The Feds are still doing their asset purchasing, and there is treasury money sitting there since the previous stimulus bill, but it will eventually be spent down. Therefore, there is a 12% increase in the money supply.
If you subtract the ten-year and the five-year treasuries to get inflation expectations in the medium to long-term, it’s the highest since that number was recorded, about 2005. On a relative basis, we see the expected inflation is higher than it’s been for the last 15 years.
Bond Prices and Interest Rates
If interest rates go up, bond prices go down, and if interest rates go down, bond prices go up. The 7-10 year treasury bonds are down 4.5%, and the S&P 500, at the time of this screenshot, was a positive 4.8- 7%. So, bonds are the way to preserve and remove the downward movement but have not been working so far year to date.
If you’re in an Exchange Traded Fund (ETF) that trades the 20-year maturity, you can see it is down 11.4%.
Inflation Expectations
Two weeks ago, we talked about the market value is and how stocks and bonds are valued the same way they value future cash flows. If the interest rate you’re discounting those future cash flows increases, you’ll see a drop in stock price. However, not all things are equal.
If inflation was more significant, then the risk-free rate increase doesn’t necessarily have a price drop. For example, if you look at future cash flows, on the left, you see a company growing its profit by 5% every year, showing what cash flow would look like. You would discount that by the same factor. Let’s say you were discounting it by 6% on the 10th. It would be 6 to the 10th power (610), and then the 9th would be discounted by 5% to the 9th power (59). So, not all stocks have this same pattern, and very few stocks have that pattern.
The idea is most of the earnings growth in a growth stock is way out in the future. If you’re discounting it and your interest rate changes, you’re going to see a sell-off in those growth stocks more than you would be valued. In simpler terms, the chart on the left shows earnings being paid currently, where the one on the right is the growth stock for you.
Effects on Present Net Value (Stock Price) of Earnings
If you were in long or short duration and interest rates did increase, the net present value of that stock would decline in both scenarios. You’re going to see a significant drop in long-duration stocks, and you’ll see a much smaller change in the short duration. On the other side, if you have falling interest rates, you’re going to see a big jump in growth stocks, and you’re not going to see a big jump in value.
Historically, value has consistently outperformed growth in the long-term, and that has not happened over the last 20 years because we’ve been in a bull market for bonds, meaning that we’ve been in a falling interest rate. Growth stocks dominated performance because of this effect.
How high can interest rates go? The fed has not started to yield curve control (YCC). However, it is likely coming because the U.S. is at $30 trillion in debt, and they cannot afford to pay just the interest with social security and medicare still on their hands. The U.S. has legal obligations that are not discretionary, so at some point, if interest rates get too high and the economy hasn’t grown to a place where tax revenue is high enough to offset it, we are in trouble.
Tech Basket
Tech companies tend to be growth companies that have that long duration that I talked about above. A non-profitable tech company or a company with growth projections in the future and is not profitable now allows us to see and measure their duration. Also, inflation, which is the ability to pass increase costs, needs to have a shorter-term considering the rising rate environment.
Cost-Push — Ability to Pass Increased Costs to Consumers
What is the demand, and what is the structure people will use in their minds whenever they’re budgeting out? If we see inflation, what are the things that are going to continue to be bought?
If commodity prices increase, you will see things being bought that consumers use every day, such as coffee and construction. Technology is one thing that may not be purchased because it has had difficulty pushing off inflation costs due to its deflationary effect. You can see this in the Radio Shack ad that we have mentioned before.
The ad shows a 20-year old $1,600 computer has 20 megabytes. Our phones are 1300 times that, and the drive we use in the office is nine terabytes. The amount of data that we use is all relative. Today’s phones can do everything and more but don’t cost as much as that computer. This is probably the area that we are unlikely to see many inflation costs being pushed out on the consumer.
If you want to learn more about our firm, we encourage you to visit our newly revamped website with some great information.
Keep up to date on Gatewood Wealth Solutions through our daily 3x3s and our weekly market insights on our YouTube,Facebook, and LinkedIn accounts.
The opinions voiced in this material are for general information only and are not intended to provide specific advice or recommendations for any individual. All performance referenced is historical and is no guarantee of future results.
All indices are unmanaged and may not be invested directly. The economic forecasts outlined in this material may not develop as predicted, and there can be no guarantee that the strategies promoted will be successful.
All investing involves risk, including the possible loss of principal. No strategy assures success or protects against loss.
Securities and advisory services are offered through LPL Financial, a registered investment advisor, Member FINRA/SIPC.
Deflation