Much has changed since then. Tax filing season opened on January 26th, more than three million families have now signed up, a Super Bowl ad ran during the pregame broadcast, President Trump promoted the accounts during his State of the Union address on February 24th and directed the nation to trumpaccounts.gov, and a new online sign-up option just launched.
Here’s our refreshed take on what this program means for your family.
The Basics: What Are Trump Accounts?
Trump Accounts, formally known as 530A Accounts under the One Big Beautiful Bill Act, are a new type of individual retirement account designed specifically for children. They’re custodial in nature, meaning a parent or guardian controls the account until the child turns 18.
How the Trump Accounts Actually Work
Eligibility: Any U.S. citizen under age 18 with a valid Social Security number can have an account opened on their behalf. Each child may have only one Trump Account.
Account Benefits
The $1,000 Seed: Children born between January 1, 2025 and December 31, 2028 who are U.S. citizens are eligible for a one-time $1,000 pilot program contribution from the U.S. Treasury. This deposit is expected no earlier than July 4, 2026.
Annual Contributions: Families, employers, and others may contribute up to a combined $5,000 per child per year. Employers may contribute up to $2,500 (per employee) of that amount under Section 128 as a fringe benefit. The $5,000 limit will be adjusted for inflation starting in 2027. No earned income is required, and contributions don’t affect traditional or Roth IRA limits for the contributor.
Account Limitations
Charitable & Government Contributions: Qualified general contributions from government entities and 501(c)(3) organizations do not count against the $5,000 annual limit. These are separate and additive.
Investment Rules: All funds must be invested in low-cost, broad U.S. equity index funds or ETFs tracking qualified indexes such as the S&P 500. Annual fees are capped at 0.10% (10 basis points), and no leverage is permitted.
No Withdrawals Before 18: Generally, no distributions may be made before the year the child turns 18, with very limited exceptions for death, excess contributions, and certain rollovers.
What’s New About Trump Accounts Since December
1. Tax Season Sign-Ups Are Live
As of January 27, 2026, families can elect to open Trump Accounts by filing IRS Form 4547 with their 2025 federal tax return. The form includes two elections: one to open the account and one to request the $1,000 pilot program contribution (if eligible).
The form accommodates up to two children and families with more eligible children can attach additional copies. Filing electronically with your tax return is the fastest and easiest method.
2. New Online Sign-Up Option
Following the Invest America Super Bowl ad last weekend, a new online sign-up form launched at trumpaccounts.gov, ahead of the originally planned mid-2026 timeline. This gives families a second pathway to open accounts outside of the tax filing process. Here’s what the sign-up experience looks like:
The Form 4547 election page at trumpaccounts.govConfirmation and next steps after submission
3. Over Three Million Families Have Enrolled
According to the White House, more than three million families had signed up as of the State of the Union address on February 24th. That milestone was up from one million just five days into tax filing season, and Treasury Secretary Scott Bessent noted that approximately 500,000 elections were made in the first three days alone. During the speech, President Trump called the program “something that’s so special” that has “taken off and gone through the roof,” and directed the nation to sign up at trumpaccounts.gov.
4. Activation Timeline
After filing Form 4547, the Treasury Department will contact parents starting in May 2026 to complete an identity verification process and activate accounts. You’ll be contacted by the partner financial firm where your Trump Account will be held with further instructions. Contributions and seed deposits will begin on July 4, 2026.
5. The Dell Foundation Gift
Michael and Susan Dell have pledged $6.25 billion to seed accounts for approximately 25 million children who missed the eligibility cutoff for the $1,000 federal deposit. Their gift provides $250 per eligible child. To qualify for the Dell contribution, children must be age 10 or under, born before January 1, 2025, and live in ZIP codes where the median household income is below $150,000. This is expected to reach children across roughly 75% of U.S. ZIP codes.
An important clarification: The Dell gift goes to a different population than the Treasury’s $1,000. It is not $250 on top of $1,000. Children born 2025 through 2028 receive the $1,000 government seed. Children born before 2025 who are age 10 and under may receive the $250 Dell contribution. Both groups benefit, but through separate funding streams.
6. Growing Employer and Corporate Support
A growing list of major U.S. corporations have pledged matching deposits or contributions for employees. Venture capitalist Brad Gerstner has also pledged $250 for each child under five with a Trump Account in Indiana. We expect this trend of employer and philanthropic participation to continue expanding.
How the Tax Treatment Works
Understanding the tax treatment matters because it affects whether you should add your own money to these accounts or use other vehicles instead.
Think of it in two phases:
PHASE 1: Before Age 18 (The Accumulation Phase)
During childhood, contributions are made with after-tax dollars, and investment growth accumulates tax-deferred. Parents or guardians maintain control of the account during this period. This phase is straightforward.
PHASE 2: After Age 18 (The IRA Conversion Phase)
At age 18, Trump Accounts automatically convert to traditional IRAs. This conversion fundamentally changes how the account functions:
What Changes on Trump Accounts for Those Over 18?
Access and Control: The young adult gains full control as the account becomes a traditional IRA in their name.
Withdrawals and Taxes: This is where it gets important. Distributions are taxed as ordinary income on all earnings and growth (though your original contributions come back tax-free). Additionally, the 10% early withdrawal penalty applies to distributions before age 59½.
The Exception Rules:
The 10% penalty (not the taxes) can be waived for:
First-time home purchases (up to $10,000)
Qualified education expenses
Business startup costs in certain circumstances
Here’s the crucial point many families miss: These “qualified expenses” only waive the 10% penalty—they do NOT eliminate the ordinary income tax on the earnings. Even when funding college or buying a first home, you’ll owe income tax on all the growth.
Investment Flexibility: After conversion, the account can be invested more broadly according to traditional IRA rules, no longer restricted to designated index funds.
Why This Matters: This automatic conversion to a traditional IRA means families should carefully consider whether contributing their own funds makes sense compared to other savings vehicles like 529 plans (where qualified education withdrawals are completely tax-free) or custodial accounts (where flexibility is greater).
Our General Perspective on Trump Accounts
Accept the free money. If your child qualifies for the $1,000 Treasury seed or the $250 Dell contribution, opening an account is straightforward. You’re accepting a gift with no cost to you. We’d help every eligible family capture this benefit. The Treasury projects that the $1,000 seed alone could grow to roughly $6,000 by age 18, $15,000 by age 27, or over $243,000 by age 55, assuming historical market returns.
Think carefully about your own contributions. For most families whose primary goal is funding education, 529 plans still deliver better tax outcomes. A 529 offers completely tax-free growth potential and withdrawals for qualified education expenses. Trump Accounts tax all growth as ordinary income at withdrawal, even for education. That’s a meaningful difference.
When Trump Accounts Make Sense for Your Plan
That said, Trump Accounts can make sense when:
You’re already maximizing 529 contributions and want additional tax-advantaged savings
Your priority is very long-term wealth building, with retirement savings starting at birth
You’re targeting a first home down payment for your child
Your employer is offering matching contributions, which is additional free money worth capturing
You want to diversify across savings vehicles with different tax treatments
Check with your employer. A growing number of companies are pledging contributions to Trump Accounts as an employee benefit. If your employer is participating, that’s money you don’t want to leave on the table, similar to a 401(k) match.
Action Steps for Families
File Form 4547 with your 2025 tax return. This is the fastest way to open an account and elect the $1,000 pilot program contribution for eligible children. You can also sign up online at trumpaccounts.gov now.
Check your employer’s plans. Ask your HR or benefits team whether your company is making Trump Account contributions under Section 128.
Don’t rush your own contributions. Contributions won’t be accepted until July 4. Use this time to evaluate whether a Trump Account, 529 plan, or combination makes the most sense for your family’s goals.
Keep records. Documentation of contribution sources matters for future distribution taxes and rollover reporting. Start organized from day one.
How Gatewood Can Help You Analyze Trump Accounts
This program launches on July 4, which gives us time to plan strategically together. The questions we help families answer are straightforward but important:
Does your family qualify for the maximum benefits?
Should you contribute your own funds, or does a 529 or custodial account better serve your goals?
And how does this fit into your broader wealth-building strategy?
We specialize in exactly these conversations, the kind where “it depends” actually becomes “here’s exactly what makes sense for you.” We’re fiduciary advisors, so this isn’t about selling you on Trump Accounts. It’s about helping you make the most informed choice for your family’s specific circumstances.
Ready to discuss strategy?
Important Considerations
This program is new, and IRS regulations continue to evolve. The information provided here reflects program details as understood in December 2025, but specific rules and procedures may change as implementation progresses. Investment returns are not guaranteed, and tax laws may change. This material is educational and not a recommendation for any specific action.
For personalized guidance on whether Trump Accounts make sense for your family, we encourage you to consult with a financial advisor and tax professional who can evaluate your complete financial picture.
Important Disclosures
Content in this material is for general information only and not intended to provide specific advice or recommendations for any individual. Gatewood Wealth Solutions and LPL Financial do not provide legal or tax advice or services.
All investing involves risk including loss of principal. No strategy assures success or protects against loss.
The opinions voiced in this material are for general information only and are not intended to provide specific advice or recommendations for any individual. All performance referenced is historical and is no guarantee of future results. All indices are unmanaged and may not be invested into directly.
This information is not intended to be a substitute for specific individualized tax or legal advice. We suggest that you discuss your specific situation with a qualified tax or legal advisor.
Prior to investing in a 529 Plan investors should consider whether the investor’s or designated beneficiary’s home state offers any state tax or other state benefits such as financial aid, scholarship funds, and protection from creditors that are only available for investments in such state’s qualified tuition program. Withdrawals used for qualified expenses are federally tax free. Tax treatment at the state level may vary. Please consult with your tax advisor before investing.
What is the biggest risk you face in retirement? If you said the stock market, you are not alone. Most retirees point to market volatility as the thing that keeps them up at night. A bad quarter. A correction. A bear market that arrives at the worst possible time. Those fears are real, and they are understandable.
But what if the biggest risk is not the one that makes headlines? What if it is the one that never makes a sound?
Volatility is the risk you can see. Inflation is the risk you can feel.
A market downturn is dramatic. It shows up on the news, in your quarterly statement, and in conversations at dinner parties. But inflation works differently. It does not announce itself. It does not send a notification. It simply makes everything around you a little more expensive, year after year, until the retirement you planned for costs far more than you expected. And by the time most people notice, the damage is already done.
This is not a theoretical concern. If the last few years have taught us anything, it is that inflation is not a relic of the 1970s. It is here, it is real, and it affects every family planning for or living in retirement. Between 2021 and 2023, Americans experienced the sharpest rise in consumer prices in over four decades. Grocery bills surged. Healthcare costs climbed. Energy prices spiked. And for retirees living on a fixed income, every one of those increases landed harder than it did for someone still receiving annual raises at work.
The question is not whether inflation will affect your retirement. It is whether your plan accounts for it.
What Inflation Actually Does to Your Money
Inflation is often described as the rate at which prices rise. But for a retiree, a more useful definition is this: inflation is the rate at which your money loses its ability to support your life.
Think of your retirement savings as a block of ice on a warm day. You can see the block. You can measure it. It looks solid. But the moment you set it outside, it begins to shrink. Not quickly. Not dramatically. But steadily and relentlessly. Inflation works the same way. Your account balance may look the same on paper, but its ability to buy the things you need is slowly melting away.
Consider what everyday costs looked like just 20 years ago. In 2005, a gallon of milk cost about $3.20. Today, that same gallon runs about $4.05. A movie ticket was $6.41. Today, the average is closer to $11. A first-class postage stamp cost $0.37. Today, it is $0.73, nearly double. These are not luxury items. These are the ordinary costs of living.
Now multiply that pattern across everything a retiree spends money on: groceries, utilities, property taxes, home maintenance, insurance, travel, and especially healthcare. Healthcare costs have risen more than 120% since 2000, consistently outpacing overall inflation. For retirees who spend a larger share of their income on medical care, the effective rate of inflation they experience is often significantly higher than the headline number.
Your grocery bill does not care what the CPI says. It charges you what it charges you.
And that headline number, the one you hear on the news, is itself misleading. The Consumer Price Index is an average across all consumers. It weighs housing, transportation, food, healthcare, and dozens of other categories into a single number.
But retirees do not spend like the average consumer. They spend disproportionately more on healthcare, which has been rising at 5% to 6% per year. They spend more on housing maintenance, insurance, and prescription drugs. Less on gas for a daily commute. Less on work clothing. The official inflation rate might say 3%. But the inflation a retiree actually experiences at the checkout counter, at the pharmacy, and at the doctor’s office can be 4%, 5%, or higher.
Headline inflation is a national average. Your inflation is personal. And for most retirees, it is higher than the number they see on the evening news. This gap between the reported rate and the rate you actually live with is one of the most underestimated risks in all of retirement planning.
The Raise You No Longer Get
Here is something most people never think about until it is too late: for your entire working career, you had a built-in defense against inflation. It was called a raise.
Every year or two, your salary went up. Maybe it was a cost-of-living adjustment. Maybe it was a promotion. Maybe it was a new job with a higher offer. Whatever the reason, your income was quietly rising alongside the cost of living. You may not have even noticed inflation during those years because your paycheck was keeping pace. The groceries cost more, but you were earning more. The insurance premiums went up, but so did your bonus. The escalator was carrying you upward, and you barely had to think about it.
The moment you retire, that escalator stops.
Your income becomes fixed. Your expenses do not.
Now you are taking the stairs. Every price increase you encounter, at the grocery store, at the pharmacy, on your insurance bill, comes directly out of your purchasing power with no offsetting raise to absorb it. The inflation that was invisible during your working years suddenly becomes very visible, because there is no longer an automatic mechanism to counteract it.
This is one of the most jarring transitions in retirement, and one of the least discussed. People plan for the loss of a paycheck. They plan for the shift from saving to spending. But very few plan for the loss of the annual raise that was silently protecting them from inflation their entire adult lives.
Think of it like running on a moving sidewalk at the airport. You feel like you are keeping a comfortable pace, but the belt beneath your feet is doing half the work. The moment you step off that belt and onto the regular floor, you realize how much effort it actually takes to maintain the same speed. Retirement is the moment you step off the belt. Inflation is the distance you now have to cover on your own.
You do not feel inflation when your income is rising. You feel every bit of it when your income stops.
The 20-Year and 30-Year Reality: What Retirement Actually Costs
Here is where the math becomes personal.
Meet Richard and Diane. Both are 65 and just retired. Their annual living expenses are $100,000. They feel comfortable. Their savings are solid. Their Social Security is in place. They believe they have enough.
But have Richard and Diane considered what their life costs at 85? What about at 95?
At an average inflation rate of just 3% per year, which is close to the long-term historical average, here is what happens to their purchasing power:
Year
Age
Annual Cost of the Same Lifestyle
Purchasing Power of Original $100,000
Today
65
$100,000
$100,000
Year 10
75
$134,400
$74,400
Year 20
85
$180,600
$55,400
Year 30
95
$242,700
$41,200
*Assumes 3% average annual inflation. Figures are approximate and for illustrative purposes only.
Read that last row again. If Richard and Diane live to 95, their $100,000 lifestyle will cost nearly $243,000 per year just to maintain the same standard of living. And if they did nothing to grow their savings, the purchasing power of every dollar they set aside would be worth less than 42 cents.
Their account balance did not shrink. Their life just got more expensive around it.
And this assumes a 3% rate. Healthcare inflation has historically averaged closer to 5% to 6%. For retirees whose medical costs represent a growing share of their budget with each passing year, the erosion is even steeper.
This is not a hypothetical exercise. People are living longer. A healthy 65-year-old couple today has a reasonable probability that at least one of them will live past 90. A 30-year retirement is no longer an outlier. It is a planning reality. And that means inflation is not a short-term nuisance. It is a structural force that your portfolio must be designed to outpace.
The Social Security “Raise” That Doesn’t Keep Up
At this point, many retirees will say, “But my Social Security is adjusted for inflation. I get a cost-of-living increase every year.”
That is true. Social Security provides an annual cost-of-living adjustment, known as the COLA. And on the surface, it sounds like the perfect protection. Prices go up, your benefit goes up. Problem solved.
Except the COLA is not calibrated to your life.
The Social Security COLA is based on a measure called the CPI-W, which tracks inflation for urban wage earners and clerical workers. Not retirees. Wage earners. That index reflects the spending patterns of someone still working: commuting costs, work clothing, lunches out, childcare. It underweights the categories that dominate a retiree’s budget, particularly healthcare, prescription drugs, supplemental insurance, and long-term care.
So what does this mean in practice? In a year where the COLA gives you a 2.8% increase, your actual cost of living may have risen 4% or 5% because your healthcare premiums climbed, your prescription costs increased, and your Medicare Part B went up more than the general index. You received a raise. It just was not big enough.
Every year the COLA falls short, the gap compounds. And it never catches up.
Think of it like a roof with a slow leak. Each year, a little more water gets in. In year one, you barely notice. By year five, there is a stain on the ceiling. By year fifteen, the damage is structural. The COLA is patching the roof every January, but it is using a patch that is slightly too small. Over a 20- or 30-year retirement, the cumulative shortfall between what your COLA covers and what your life actually costs can amount to tens of thousands of dollars in lost purchasing power.
This is not a flaw in Social Security. The program does what it was designed to do. But it was never designed to be your sole defense against inflation. It was designed to be a floor, not a ceiling. The rest of the protection has to come from your investment portfolio, your withdrawal strategy, and the planning that ties them together.
If your plan assumes the COLA fully protects you from inflation, your plan has a gap. And that gap gets wider every year you are in retirement.
The Conservation Trap: Why Playing It Safe Can Be the Riskiest Move
Here is where the well-meaning instinct of most retirees can actually work against them.
Meet Carol. Carol just retired at 65 with $1.2 million in savings. She worked hard for that money. She watched it grow over decades. And now that she has crossed the finish line into retirement, her first instinct is to preserve it. She tells her advisor, “I don’t want to lose what I’ve built. Let’s move everything into something safe.”
It is a natural reaction. After a career of accumulating, the shift to spending feels vulnerable. The idea of a market decline wiping out years of savings is terrifying. So, Carol moves heavily into bonds, CDs, and money market funds. She feels confident.
But is Carol’s money actually less vulnerable?
If Carol’s “less vulnerable” portfolio earns 3% to 4% per year, and inflation averages 3%, her real return, the growth that actually matters, is close to zero. She is running on a treadmill. Her balance may hold steady, but its ability to fund her life is declining every single year. In 20 years, her $1.2 million buys what $660,000 buys today. In 30 years, it buys what $490,000 buys today.
Preservation of principal is not the same thing as preservation of purchasing power.
This is the distinction that changes everything. The goal of retirement investing is not to keep your account balance from going down. The goal is to make sure your money can still support your life five, ten, twenty, and thirty years from now. A portfolio that never declines but never grows in real terms is not less vulnerable. It is slowly failing.
Think of it this way. If you put food in the freezer to preserve it, the food looks the same. The weight is the same. The packaging is intact. But if the freezer is slowly losing power, the food is spoiling from the inside out. By the time you open it years later, what looked preserved is no longer usable. That is what inflation does to a portfolio that is not built to grow.
The real risk in retirement is not a bad quarter in the stock market. It is a quiet decade of falling behind.
The Tax Toll: Why Your Returns Are Smaller Than You Think
If the inflation conversation stopped here, it would be concerning enough. But there is another force working against your purchasing power that makes the math even more difficult: taxes.
When you hear that a conservative portfolio returned 4% to 5% last year, that number is pre-tax. But inflation does not charge you pre-tax prices. Every gallon of milk, every doctor’s visit, every utility bill, every property tax payment is made with after-tax dollars. The cost of living is an after-tax reality. And that mismatch is where many retirees quietly fall behind.
Let us walk through the math. Suppose your portfolio earns 5% in a given year. Depending on the type of account and the nature of the income, whether it is ordinary income from bonds or a traditional IRA distribution, or capital gains from a taxable brokerage account, you may owe 15% to 30% or more in federal and state taxes on those gains. At a 25% effective tax rate, your 5% return becomes 3.75% after taxes. Now subtract inflation at 3%. Your real, after-tax return is 0.75%.
Less than one percent. That is what you actually kept.
And remember, that 3% inflation figure is the headline number. If your personal inflation rate is closer to 4% or 5% because of healthcare costs, your real after-tax return may be zero. Or negative. You earned a positive return on your statement, paid taxes on it, and still lost ground to the cost of living.
Think of it like a tollway. Your investment returns are driving toward your wallet. But before they arrive, they have to pass through a tax tollbooth. A portion of every dollar is collected before it ever reaches you. Meanwhile, inflation is raising the prices at your destination at the full rate, no tollbooth, no discount, no deduction. The prices you pay at the grocery store, the pharmacy, and the gas station are not reduced because you paid taxes on your investment gains. Inflation charges full fare on the other side of the toll.
Your returns are taxed. Inflation is not. That asymmetry is one of the most overlooked realities in retirement planning. It means that a portfolio earning 4% to 5% before taxes, which sounds reasonable, may only deliver 2% to 3.5% after taxes. And when you subtract real-world inflation at 3% to 5%, you are left with a razor-thin margin, or worse, you are going backward.
This is precisely why keeping up with inflation requires more than a conservative portfolio.
You need the type of growth that equities provide, and you need a strategy that manages your tax exposure along the way. Roth conversions, tax-efficient withdrawal sequencing, asset location across taxable, tax-deferred, and tax-free accounts: these are not optional add-ons. They are essential tools for making sure more of your return actually reaches your purchasing power.
It is not what your portfolio earns that matters. It is what you get to keep after taxes, after inflation, after life.
Why Equities Still Matter After You Retire
If inflation is the disease, then equities are the long-term medicine.
Historically, stocks have been the only asset class that has consistently outpaced inflation over extended periods. Bonds provide balance. Cash provides liquidity. But neither has the growth engine necessary to keep your purchasing power intact over a 20- or 30-year retirement.
This does not mean a retiree should have 100% of their portfolio in stocks. It means that having too little in equities may actually be more dangerous than having too much, especially when the retirement could last three decades.
Here is the tension most retirees face: they understand, at least intellectually, that they need growth. But when the market drops 15% or 20%, the emotional response is overwhelming. They want to sell. They want to move to cash. They want to make the pain stop. And if their advisor has not built a strategy to manage that emotional reality, the client often makes the worst possible decision at the worst possible time.
You cannot outrun inflation from the sideline. You have to stay in the game.
So how do you stay invested in equities, which you need for long-term growth, while also preserving your assets from the short-term volatility that makes equities so difficult to hold? How do you keep your foot on the gas and still feel confident?
At Gatewood Wealth Solutions, this is exactly the problem our cash strategy was designed to solve.
Bear Market Ready, Bull Market Positioned: How Our Cash Strategy Works
Most advisors and institutions approach retirement investing with a simple formula: as you get older, shift more of your portfolio into bonds and cash. The thinking is simple. Less volatility equals less risk. And for many firms, the standard recommendation is something like a 60/40 or even 50/50 stock-to-bond allocation by the time you reach retirement.
But we believe this conventional approach misidentifies the risk. It focuses on reducing volatility when the real enemy is inflation. The result? Portfolios that feel comfortable but do not grow fast enough to keep up with the rising cost of life.
At Gatewood, we take a different approach. We call it being “Bear Market Ready, but Bull Market Positioned.” The foundation of this strategy is our Cash Target.
Here is how it works. Rather than shifting large portions of a retiree’s portfolio into bonds simply because they have reached a certain age, we calculate a precise amount of cash that each client should hold in a dedicated cash reserve. This Cash Target is based on the client’s actual monthly expenses, their income sources like Social Security and pensions, and our Investment Committee’s current assessment of market conditions.
The purpose of this cash reserve is simple but powerful: it provides the income a client needs to live on for a defined period of time, regardless of what the stock market is doing. If the market enters a downturn, we draw from the cash reserve rather than selling investments at depressed prices. This gives the invested portion of the portfolio time to recover without being raided during a decline.
Cash buys you time. Time allows your investments to recover. Recovery preserves your purchasing power.
Think of it like a water tower for a community. On a normal day, water flows from the main supply and the tower stays full. But when the main supply is interrupted, whether by a storm or a maintenance issue, the water tower provides steady, reliable service until the supply comes back online. No one panics. No one goes without water. The reserve does its job, and life continues normally.
That is exactly what the cash reserve does for our clients. It is their water tower. When the market is strong, we replenish it. When the market declines, we draw from it. And because our clients know they have this buffer, they have the confidence to remain invested in equities at higher levels than they might otherwise tolerate.
This is the key insight: the cash strategy is not about the cash itself. It is about what the cash allows you to keep invested. By separating the money that you need in the short term from the money that needs to grow over the long term, we give clients the confidence they need emotionally and the growth they need financially.
How This Strategy Preserves Purchasing Power Over Decades
Let us return to Carol, the retiree who wanted to “play it safe.” What would her retirement look like under two different approaches?
Scenario A: The conventional approach. Carol moves to a conservative 40% stock, 60% bond allocation. Her portfolio grows at roughly 4% to 5% per year before taxes. After taxes and inflation, her real return is near zero, or possibly negative in years when healthcare costs spike. Over 25 years, her purchasing power slowly deteriorates. By 85, she is making difficult choices about healthcare, travel, and the lifestyle she planned for. By 90, she is drawing down principal faster than she expected. Her statement looked less vulnerable. Her life did not feel less vulnerable.
Scenario B: The Gatewood approach. Carol maintains a higher equity allocation, perhaps 65% to 75% in stocks, because she has a cash reserve covering 12 to 24 months of living expenses. Her portfolio grows at 7% to 8% over time. With tax-efficient strategies like Roth conversions, strategic withdrawal sequencing, and thoughtful asset location, more of that return actually reaches her wallet. After taxes and inflation, her real return is meaningfully positive. When the market dips, she draws from her cash reserve instead of selling stocks at a loss. When the market recovers, she replenishes the reserve. Over 25 years, her portfolio has not just survived inflation and taxes. It has outpaced them. She is living the same lifestyle at 90 that she planned at 65.
Same starting balance. Same retirement. Vastly different outcomes.
The difference is not luck. It is structure. Carol’s portfolio in Scenario B was designed to grow because the cash strategy removed the pressure to sell during downturns. She did not need to become less invested as she aged. She needed to become more intentional about how her money was organized.
Think of it like a home with a well-stocked pantry. If you know you have three months of food in the house, a winter storm does not send you into a panic. You do not rush to the store in dangerous conditions. You wait. You are prepared. And when the storm passes, you resupply calmly, on your terms. That is the emotional and financial freedom our cash strategy creates.
Inflation Is Not Just Your Problem. It Is a Family Problem.
When we talk about inflation eroding purchasing power, we are not just talking about one person’s retirement. We are talking about the ripple effects that reach across an entire family.
When a retiree’s savings cannot keep up with the cost of living, the burden often shifts.
Adult children step in to help with medical bills, home repairs, or daily expenses. Family vacations get scaled back or canceled. Inheritances that were intended to provide a head start for the next generation shrink or disappear entirely. The financial strain does not stay contained. It radiates outward.
Inflation does not just affect your retirement. It affects your family’s future.
This is why at Gatewood, we think about inflation through the lens of our Firm-to-Family™ approach. When we build a plan, we are not just asking whether your money will last until age 90. We are asking whether your plan preserves the financial independence that allows you to live on your terms, support the people you love, and leave the legacy you intended. Inflation threatens all of it. Your investment strategy must account for all of it.
What You Can Do About It
Inflation may be beyond your control, but your response to it is not. Here are the questions every retiree and pre-retiree should be asking:
Is my portfolio built to grow, or just to survive? If your investments are primarily in bonds, CDs, and money market funds, your portfolio may be falling behind inflation every year. Ask your advisor what your real return has been after accounting for inflation.
Do I have a cash strategy that allows me to stay invested? If a market downturn would force you to sell stocks to pay your bills, your portfolio is not structured properly. A dedicated cash reserve gives you the freedom to weather short-term volatility without sacrificing long-term growth potential.
Have I stress-tested my plan for a 30-year retirement? Many financial plans are modeled for 20 years. But if you are 65 and healthy, planning to age 85 may not be enough. Ask to see what your plan looks like at 90 and 95 with varying inflation assumptions.
Am I thinking about inflation as a fixed number, or as a category-by-category reality? Healthcare inflation runs significantly higher than general inflation. If medical costs are a growing part of your budget, your effective inflation rate may be 4% or 5%, not the 2.5% to 3% headline number.
Is my advisor managing for preservation of principal, or preservation of purchasing power? There is a significant difference. One preserves the number on your statement. The other preserves the life that number is supposed to fund.
Ask the right question, and the right strategy follows.
Wealth Is Personal. So Is Inflation.
At Gatewood Wealth Solutions, we believe that wealth is personal. Your retirement is not a spreadsheet exercise. It is your life, your family’s security, and your ability to do the things that matter most to you for as long as you live. Inflation is the force that quietly threatens all of it.
That is why we do not build portfolios designed to avoid discomfort. We build portfolios designed to sustain purchasing power. Our cash strategy gives clients the confidence to remain invested in equities at levels that can outpace inflation, while the cash reserve provides the confidence to ride through the inevitable downturns along the way.
The true value of planning is the confidence it creates. When you understand how inflation affects your plan, when you have a strategy that accounts for it, and when you know that your cash reserve is there to keep you from selling and manage your lifestyle during the difficult stretches, you do not need to fear the market. You do not need to hide from it. You can participate in the growth potential that keeps your purchasing power intact for decades.
If you want to see what inflation is doing to your specific plan, or if you want to understand how our cash strategy could change the trajectory of your retirement, we would welcome that conversation. Reach out to us at Gatewood Wealth Solutions. We keep your priorities the priority, and purchasing power is always one of them.
Protect what your money can do, not just what it says on the statement.
Important Disclosures
Content in this material is for general information only and not intended to provide specific advice or recommendations for any individual. Gatewood Wealth Solutions and LPL Financial do not provide legal or tax advice or services.
All investing involves risk including loss of principal. No strategy assures success or protects against loss.
The opinions voiced in this material are for general information only and are not intended to provide specific advice or recommendations for any individual.
This information is not intended to be a substitute for specific individualized tax or legal advice. We suggest that you discuss your specific situation with a qualified tax or legal advisor.
This is a hypothetical example and is not representative of any specific situation. Your results will vary. The hypothetical rates of return used do not reflect the deduction of fees and charges inherent to investing.
Bonds are subject to market and interest rate risk if sold prior to maturity. Bond values will decline as interest rates rise and bonds are subject to availability and change in price.
Stock investing includes risks, including fluctuating prices and loss of principal.
Traditional IRA account owners have considerations to make before performing a Roth IRA conversion. These primarily include income tax consequences on the converted amount in the year of conversion, withdrawal limitations from a Roth IRA, and income limitations for future contributions to a Roth IRA. In addition, if you are required to take a required minimum distribution (RMD) in the year you convert, you must do so before converting to a Roth IRA
CTAs are created and managed in Hubspot, the Embed Code will be used here in the HTML version of the blog.
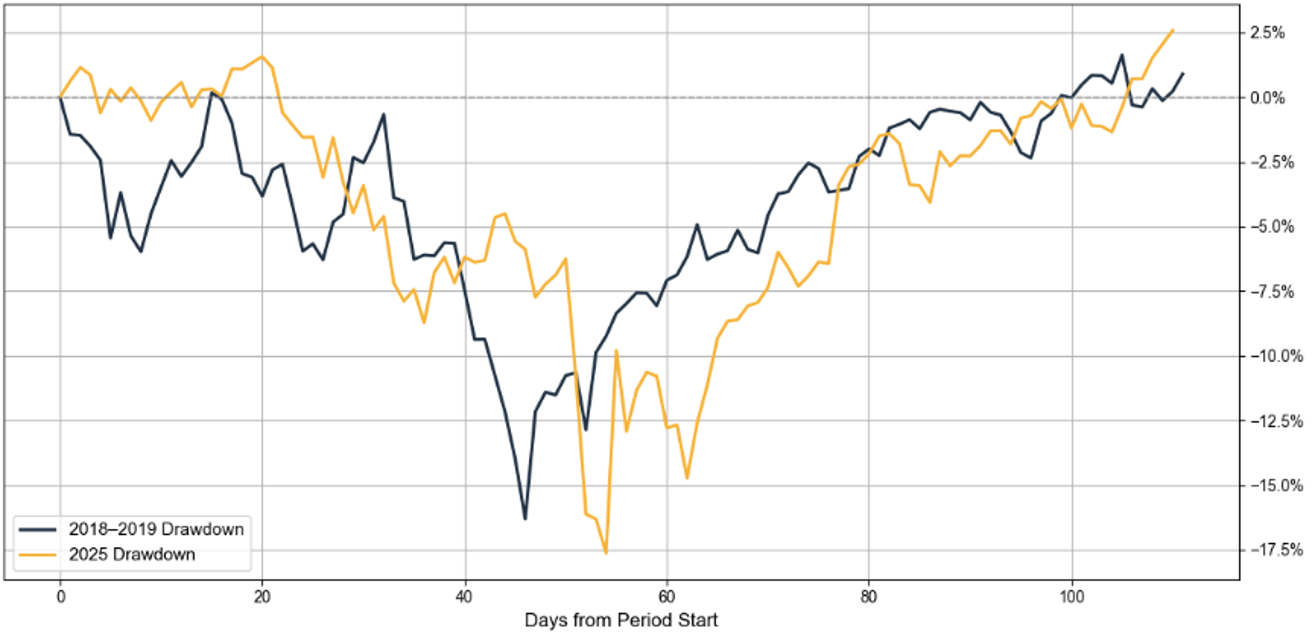
Ten months ago, the sky was falling.
Sweeping tariff announcements sent the S&P 500 plunging nearly 20% from its February 2025 peak, wiping out over $6 trillion in market value in two trading sessions. Headlines screamed recession. Pundits predicted the worst. The temptation to sell everything and hide in cash was overwhelming.
Here’s what our clients did: absolutely nothing.
Their strategy, Fortress Gatewood, held. Their fortress held. Their portfolios recovered, and then some.
Zero families served by Gatewood Wealth Solutions panic sold during the 2025 market correction. Not one.
Today, the S&P 500 is trading near all-time highs. But we’re not writing this to celebrate. We’re writing it because the next correction is coming, and the real question is whether you’ll be ready.
What Happened: The 2025 Tariff Correction
On February 19, 2025, the S&P 500 closed at an all-time high of 6,144.
Then things got ugly. Fast.
February 19 to March 13: The S&P 500 dropped over 10% on tariff fears alone, entering correction territory before “Liberation Day” even arrived.
April 2 to April 8: Sweeping tariffs on nearly all U.S. trading partners triggered the worst two-day loss in S&P 500 history. The VIX spiked to levels not seen since the COVID-19 pandemic.
April 8: The bottom. The S&P 500 sat nearly 19% below its February peak, flirting with official bear market territory.
Then, just as quickly, the reversal. A 90-day tariff pause on April 9 sent the S&P 500 surging 9.5% in a single session, one of its best days ever. By May 13, the index was positive for the year. By June 27, it hit a new all-time high.
From the April 8 bottom to today, the S&P 500 has gained roughly 40%.
The entire round trip took about four months. Investors who sold at the bottom missed all of it.
What Is Fortress Gatewood?
Fortress Gatewood is the planning framework we use to help families navigate market volatility without being forced into reactive decisions. It’s built around intentional layers (or “moats) of liquidity, income, and long-term growth, each aligned to different time horizons and real-world spending needs.
By clearly separating short-term cash needs, intermediate income sources, and long-term growth capital, the structure helps clients understand which dollars are meant to be used now, which are designed to support future income, and which are positioned for long-range objectives.
The goal isn’t to predict markets, but to create enough flexibility and clarity that market movement doesn’t dictate decisions when it matters most.
Download Your Free Copy
How the Fortress Worked
This is exactly the scenario Fortress Gatewood was designed for.
Moat Ring 1: Cash. Two years of spending in liquid reserves. No one needed to sell a single share to pay their bills. No forced selling. No panic.
Moat Ring 2: Fixed Income. Five to eight years of high-quality bonds provided less volatility with stable income. A second wall of defense while equities took the hit.
Moat Ring 3: Equities. Long-term growth capital with a 7 to 10+ year horizon. Because no one was relying on these funds for near-term needs, they could ride the storm and capture the rebound.
But here’s what made the difference: we didn’t just defend. We attacked.
On April 7, 2025, one day before the market bottomed, Chris Arends and the Gatewood Investment Committee sent guidance to every advisor on the team:
“Please contact clients with dry powder and suggest investing 1/2 to strategy now. Dry powder means funds not earmarked for short-term or mid-term spending needs. It must be long-term (>7 years).”
— Chris Arends, Gatewood Investment Committee, April 7, 2025 at 8:47 AM
That’s not a memo written in hindsight. That’s real-time guidance, issued the morning before the market hit its lowest point.
Dry powder means long-term capital not earmarked for short-term or mid-term spending. Funds with a 7+ year horizon. Because Moat Rings 1 and 2 were fully funded, we knew exactly which dollars could go to work at depressed prices, and we deployed them with conviction.
As our investment partner, Aaron Tuttle, said that same morning:
“Since 1957, we’ve had 12 corrections in the S&P 500 greater than 20%. Half were between 20-30%, three were between 30-40%, and three were greater than 40%. If you have a lot of cash, don’t overcomplicate it. Invest half now, another quarter at a 30% drop, and go all-in, buying everything you can at a greater than 40% drop. You might only get one or two opportunities at that level in your lifetime.”
Other investors were frozen. Ours were buying.
That’s the power of a fortress.
The Bigger Picture
The 2025 correction joins a pattern every investor should know by heart:
Market Event
Decline
Recovery Time
Dot-Com Crash (2000–2002)
-49.1%
7.2 Years
Global Financial Crisis (2007–2009)
-56.8%
5.5 Years
COVID-19 Crash (2020)
-34%
~6 Months
2022 Bear Market
-27.5%
~2 Years
2025 Tariff Correction
~19%
~4 Months
Every single one felt like the end of the world. Every single one recovered. Every single time, the investors who stayed disciplined won.
But Here’s What Should Keep You Up at Night
“The biggest risks are always the ones nobody sees coming. The events that aren’t on anyone’s radar are what move the world most. People are generally good at predicting the future except for the surprises that actually matter.”
— Morgan Housel, Same as Ever
The 2025 correction was the easy version. No recession. Strong consumer spending. Resilient corporate earnings. Room for the Fed to cut rates. The economy absorbed the shock and bounced back in months. V-shaped recovery!
That won’t always be the case.
When we study the last 50 years of S&P 500 bear markets, the data is clear: the presence or absence of a recession changes everything.
Bear Markets Without a Recession (1987, 2022)
Metric
Average
Decline
-30%
Peak to Trough
~6.5 months
Full Round Trip
~23.5 months (~2 years)
Bear Markets With a Recession (1980–82, Dot-Com, GFC, COVID)
Metric
Average
Decline
-42%
Peak to Trough
~17.5 months
Full Round Trip
~46 months (~3.8 years)
Recessionary bears are 12 percentage points deeper. The decline phase is 3x longer. The total round trip takes twice as long.
And if you exclude the anomalous COVID recovery (compressed by unprecedented government intervention), the three traditional recessionary bears averaged about 5 years from peak to recovery.
Since 1975, four out of six bear markets have coincided with recessions. We are statistically due for another one. The question isn’t if. It’s when.
Are you building your fortress now, while the sun is shining? Or will you try to build it in the middle of the storm?
The Danger of All-Time Highs: Complacency
Here’s the part most people don’t want to hear: all-time highs are when fortresses get built, not when they get tested.
Right now, with markets at record levels and three straight years of strong returns behind us, it’s tempting to relax. To assume the good times will continue indefinitely. To skip the disciplined work of maintaining cash reserves and rebalancing into fixed income.
But the 2025 correction is a reminder that the next downturn doesn’t send a calendar invite. It shows up unannounced, sometimes triggered by a single speech in a Rose Garden.
With the S&P 500 near 7,000 and all-time highs stacking up, most investors are relaxed. We’re not.
We’re using this moment of strength to prepare for the next moment of weakness:
Reviewing cash positions to make sure every client has their full 2-year liquidity buffer
Rebalancing into fixed income to lock in yields and maintain the 5 to 8 year spending bridge
Harvesting equity gains to fund and strengthen the outer moat rings
Stress-testing every plan against recessionary scenarios: 40%+ drawdowns, multi-year recoveries, rising unemployment
We’re not predicting a crash. We never do. We’re preparing for one, because that’s what we always do.
The Firm to Family™ Advantage: Why the Fortress Held
Zero panic selling across our entire client base is not an accident. It’s the result of how Gatewood is built.
At most firms, the investment team doesn’t talk to the financial planner. The financial planner doesn’t talk to the tax advisor. And nobody coordinates the message to the client when markets are in freefall.
At Gatewood, our Firm to Family™ structure means every professional who touches your financial life is working from the same plan, communicating continuously, and aligned on the same strategy.
When markets dropped in April, your wealth planner could tell you with precision how many months of expenses were covered without touching a single equity position. The Investment Committee was providing real-time guidance on deploying dry powder. And the planning team was tracking the tax implications of every move to make sure nothing was done without considering the full picture.
Our clients didn’t panic because they didn’t have to. They had a plan, a team, and a fortress. And they heard from their advisor, personally, before the bottom even arrived.
The 2025 correction proved the Fortress Gatewood system works. Our clients didn’t panic. They didn’t sell. They didn’t miss the recovery. Zero families. Zero panic sales. Many of them used the downturn to buy at depressed prices and came out stronger on the other side.
But the next test might not be a four-month correction. It could be a recessionary bear market that grinds on for years. The families who navigate that with confidence will be the ones who built their fortress today, while markets were strong and emotions were calm.
Don’t wait for the storm to start digging the moat.
Important Disclosures
Content in this material is for general information only and not intended to provide specific advice or recommendations for any individual. Gatewood Wealth Solutions and LPL Financial do not provide legal or tax advice or services.
All investing involves risk including loss of principal. No strategy assures success or protects against loss.
The opinions voiced in this material are for general information only and are not intended to provide specific advice or recommendations for any individual. All performance referenced is historical and is no guarantee of future results. All indices are unmanaged and may not be invested into directly.
This information is not intended to be a substitute for specific individualized tax or legal advice. We suggest that you discuss your specific situation with a qualified tax or legal advisor.
Bonds are subject to market and interest rate risk if sold prior to maturity. Bond values will decline as interest rates rise and bonds are subject to availability and change in price.
The S&P 500 Index is a capitalization-weighted index of 500 stocks designed to measure performance of the broad domestic economy through changes in the aggregate market value of 500 stocks representing all major industries.
Appendix: Sources
S&P 500 Historical Data & 2025 Market Correction
S&P Dow Jones Indices. S&P 500 historical closing prices.
“2025 Stock Market Crash.”
NBC News. “S&P 500 Hits an All-Time High—Rebounding to Its Level When Trump’s Second Term Began.” June 27, 2025.
CBS News. “The Stock Market Is Nearing a Record High After Cratering in April. Here’s Why.” June 27, 2025.
“How the Stock Market Made Back All Its Losses After Trump Escalated the Trade War.” May 4, 2025.
CNN Business. “What to Expect From Stocks in 2026.” January 1, 2026.
S. Bank. “Stock Market Under the Trump Administration.” Updated February 4, 2026.
Trading Economics. “United States Stock Market Index.” February 10, 2026.
Bank for International Settlements. “Understanding the Swift Market Recovery After the April 2025 Tariff Shock.”BIS Quarterly Review, September 2025.
April 2025 Tariff Crash Details
CNN Business. “Dow Plunges 2,200 Points as Tariff Tumult Rocks Markets.” April 4, 2025.
“Tariff Shock: Top S&P 500 Winners and Losers (April 2–16, 2025).”
Bear Market Historical Data & Recession Analysis
S&P 500 bear market peak-to-trough and recovery data, 1975–2025.
S&P 500 historical performance and earnings data.
National Bureau of Economic Research (NBER). S. business cycle expansions and contractions.
“A History of Bear Markets.”
“A History of Stock Market Percentage Declines (15% to 50%).”
“Here’s How Often Stocks Dip 5% or More.”
Austin Wealth Management. “Dealing With the Dips.”
2026 Market Outlook & Valuation
The Motley Fool. “With the S&P 500 at an All-Time High to Start 2026, Is It Smart to Buy Stocks?” January 9, 2026.
The Motley Fool. “History Says a Turning Point Is Likely Coming for the S&P 500 in 2026.” January 1, 2026.
Visual Capitalist. “152 Years of S&P 500 Returns (and Predictions for 2026).” January 2026.
Advisor Perspectives. “S&P 500 Snapshot: Index Closes at Record High.” January 2, 2026.
Books Cited
Housel, Morgan. Same as Ever: A Guide to What Never Changes. Portfolio/Penguin, 2023.
Understanding the New Children’s Investment Accounts Launching in 2026
Every parent dreams of giving their children a head start in life. Starting in 2026, a new federal program will do exactly that—and thanks to an extraordinary $6.25 billion pledge from Michael and Susan Dell, the gift just got bigger.
Here’s what makes this program remarkable: If you have children age 10 or under, they may automatically receive up to $1,250 in free investment capital—$1,000 from the government plus $250 from the Dell Foundation. No action required beyond enrollment. For a family with two eligible children, that’s $2,500 invested in their future at no cost to you.
The question isn’t whether to accept this gift—it’s whether these “Trump Accounts” make sense as part of your broader savings strategy for your children.
What These Accounts Are Called
These accounts are commonly known as “Trump Accounts” or “Children’s Investment Accounts.” They’re formally defined in Section 530A of the One Big Beautiful Bill Act and are sometimes referenced as “530A accounts” in tax documentation.
Official Website: All program and enrollment information will be published at trumpaccounts.gov
Program Timeline
Spring 2026: Families can begin enrolling by filing IRS Form 4547 with their tax returns or through other designated methods.
Mid-2026: Online enrollment portal launches at trumpaccounts.gov.
July 4, 2026: The program formally launches with seed deposits funded, contributions enabled, and full account access available.
How Trump Accounts Work – The Basics
Eligibility
Any U.S. citizen under age 18 with a Social Security number can have an account opened on their behalf. Children born between 2025 and 2028 automatically receive a $1,000 government-funded seed deposit.
The Dell Foundation Gift
The Dell family’s $6.25 billion contribution provides an additional $250 to eligible children who meet specific criteria: age 10 and under, born before January 1, 2025, and living in ZIP codes with median household incomes of $150,000 or less. This enhancement reaches approximately 25 million children across roughly 75% of U.S. ZIP codes.
Annual Contributions
Families may contribute up to $5,000 per year per child, including employer contributions. Employers may contribute up to $2,500, which counts toward the $5,000 annual cap. Philanthropic enhancements like the Dell gift are separate and don’t count against contribution limits.
Investment Requirements
All funds must be invested in low-cost, broad U.S. equity index funds designated by the Treasury Department. Annual fees are capped at 0.1%. Accounts are initially established through the Treasury and can later be transferred to approved private financial institutions.
The Critical Detail: What Happens to the Tax Treatment
Understanding the tax treatment matters because it affects whether you should add your own money to these accounts or use other vehicles instead. Think of it in two phases:
PHASE 1: Before Age 18 (The Accumulation Phase)
During childhood, contributions are made with after-tax dollars, and investment growth accumulates tax-deferred. Parents or guardians maintain control of the account during this period. This phase is straightforward.
PHASE 2: After Age 18 (The IRA Conversion Phase)
At age 18, Trump Accounts automatically convert to traditional IRAs. This conversion fundamentally changes how the account functions:
Access and Control: The young adult gains full control as the account becomes a traditional IRA in their name.
Withdrawals and Taxes: This is where it gets important. Distributions are taxed as ordinary income on all earnings and growth (though your original contributions come back tax-free). Additionally, the 10% early withdrawal penalty applies to distributions before age 59½.
The Exception Rules:
The 10% penalty (not the taxes) can be waived for:
First-time home purchases (up to $10,000)
Qualified education expenses
Business startup costs in certain circumstances
Here’s the crucial point many families miss: These “qualified expenses” only waive the 10% penalty—they do NOT eliminate the ordinary income tax on the earnings. Even when funding college or buying a first home, you’ll owe income tax on all the growth.
Investment Flexibility: After conversion, the account can be invested more broadly according to traditional IRA rules, no longer restricted to designated index funds.
Why This Matters: This automatic conversion to a traditional IRA means families should carefully consider whether contributing their own funds makes sense compared to other savings vehicles like 529 plans (where qualified education withdrawals are completely tax-free) or custodial accounts (where flexibility is greater).
Comparing Your Options: Trump Accounts vs. 529 Plans vs. UTMA Accounts
We believe informed decisions come from clear comparisons. Here’s how Trump Accounts stack up against the savings vehicles you may already be using:
Trump Accounts offer a $1,000 government seed deposit (for children born between 2025 and 2028) plus potential philanthropic enhancements like the Dell gift. The $5,000 annual contribution limit includes employer contributions. Investment growth is tax-deferred, and the account converts to a traditional IRA at age 18. Withdrawals after 18 are taxed as ordinary income with standard IRA penalties and exceptions applying. The parent controls the account until age 18, then the child gains full access.
529 Plans have no government seed funding but offer no annual contribution limits (though lifetime caps apply by state). Contributions may be deductible at the state level. Investment growth is completely tax-free when used for qualified education expenses. Withdrawals for education are entirely tax-free, while non-education withdrawals face taxes and penalties. The account owner retains control indefinitely and can change beneficiaries.
UTMA Accounts offer no government funding and no annual limits beyond gift tax considerations. There are no tax deductions for contributions. Investment growth is taxable annually, and the kiddie tax may apply. Withdrawals can be used for any purpose benefiting the child with no special tax treatment or penalties. The child gains full, unrestricted control at age 18 to 21 (depending on state), and investment options are highly flexible.
The Bottom Line: The right choice depends entirely on your family’s priorities and timeline—which is exactly the kind of conversation we help clients navigate.
Our Perspective: When Trump Accounts Make Sense
At Gatewood, we believe in giving you straight talk about financial products—even new, politically branded ones. Here’s our professional perspective:
The free money is a no-brainer. If your child qualifies for the government seed and Dell enhancement, opening an account is essentially accepting a gift. We’d help every eligible family capture this benefit.
Your own contributions require more thought. For most families focused on education funding, 529 plans deliver better tax outcomes. The Trump Account’s conversion to an IRA at 18 means you’ll pay ordinary income tax on withdrawals—even for education. That’s objectively less attractive than a 529’s completely tax-free treatment for qualified education expenses.
But there are scenarios where these accounts shine:
You’re already maxing out 529 contributions and want additional tax-advantaged savings
Your priority is very long-term wealth building (retirement savings starting at birth)
You’re specifically targeting a first home down payment for your child
You want to diversify across multiple savings vehicles with different tax treatments
Remember that implementation details are still evolving. The IRS continues to issue guidance on program specifics, and some questions remain unanswered as of December 2025.
The key question isn’t “Are Trump Accounts good or bad?” It’s “Are they right for YOUR family’s specific goals and timeline?”
The Bigger Picture: Why This Program Was Created
This program reflects a simple idea: giving young Americans an ownership stake in the economy early can transform how they think about money, investing, and wealth-building. The policy goals include expanding equity ownership across economic classes, supplementing Social Security with private savings, and creating what policymakers call a “shareholder economy.”
Whether this achieves its lofty policy goals remains to be seen—but for individual families, the opportunity to capture free seed capital and teach children about investing is very real and tangible.
Treasury officials emphasize these accounts are designed to supplement, not replace, Social Security and other safety net programs. The long-term vision is to empower a generation with real assets, investment experience, and an ownership mindset from day one.
How Gatewood Can Help
This program launches in mid-2026, which gives us time to think strategically together. Our process focuses on three essential questions:
Does your family qualify for the maximum benefits, including the Dell enhancement?
Should you contribute your own funds, or does a 529 or custodial account better serve your goals?
How does this fit into your broader wealth-building strategy for your children’s future?
We excel at these nuanced conversations—the kind where “it depends” actually becomes “here’s exactly what makes sense for you.” This isn’t about selling you on Trump Accounts. It’s about ensuring you make the most informed choice for your family’s unique situation.
Ready to discuss your family’s strategy?
Important Considerations
This program is new, and IRS regulations continue to evolve. The information provided here reflects program details as understood in December 2025, but specific rules and procedures may change as implementation progresses. Investment returns are not guaranteed, and tax laws may change. This material is educational and not a recommendation for any specific action.
For personalized guidance on whether Trump Accounts make sense for your family, we encourage you to consult with a financial advisor and tax professional who can evaluate your complete financial picture.
Important Disclosures
Securities and advisory services are offered through LPL Financial, a registered investment advisor and broker-dealer (member FINRA/SIPC).
The opinions voiced in this material are for general information only and are not intended to provide specific advice or recommendations for any individual.
Gatewood and LPL Financial are separate entities. Gatewood Wealth Solutions does not provide legal or tax advice directly. However, Gatewood Tax & Accounting, a separate entity under the Gatewood family of companies, provides comprehensive tax planning and preparation services. For legal matters, you should consult your legal advisor regarding your personal situation. Our team coordinates closely with clients’ tax and legal professionals to help ensure comprehensive planning.
Contributions to a traditional IRA may be tax deductible in the contribution year, with current income tax due at withdrawal. Withdrawals prior to age 59 ½ may result in a 10% IRS penalty tax in addition to current income tax.
This information is not intended to be a substitute for individualized tax advice. We suggest that you discuss your specific tax situation with a qualified tax advisor.
Prior to investing in a 529 Plan investors should consider whether the investor’s or designated beneficiary’s home state offers any state tax or other state benefits such as financial aid, scholarship funds, and protection from creditors that are only available for investments in such state’s qualified tuition program. Withdrawals used for qualified expenses are federally tax free. Tax treatment at the state level may vary. Please consult with your tax advisor before investing.
Why solving our fiscal problems requires more than populist revenue
Dan’s recent blog on tariffs sparked great debate—and it’s exactly the kind of back-and-forth that makes Gatewood special. We don’t always agree, but we’re united by a deeper goal: helping clients—and the country—move forward with clarity.
In fact, Dan and I agree on much more than we disagree. We both want fiscal sanity. We both want a more secure, more sovereign America. But where I start to diverge is in how we get there—and more importantly, what costs we may be ignoring along the way.
The Patriotic Appeal
Tariffs have an undeniable surface-level appeal. They feel like we’re standing up for ourselves. They’re visible, easily framed as constitutional, and unlike the income tax, they don’t require the IRS knowing the color of your wallpaper.
For those of us who believe in limited government, sound money, and national sovereignty, tariffs can feel like a clean swap: ditch the bloated tax code, bring back duties on imports, and reignite American industry.
But that’s the illusion. We’re not replacing anything—we’re adding.
If Tariffs Fix It… Why More Debt?
Let’s be honest about the timing. If tariffs were the fix, why did the same legislative push include a $5 trillion hike to the debt ceiling?
Yes, our tax system is bloated and full of misaligned incentives. But changing the source of tax revenue without reducing the need for tax revenue just feeds the same appetite with a different spoon.
Dan—and even the Trump administration, at times—have argued that no one is offering serious spending cuts. But that’s not quite accurate. DOGE is actually an example of a proposed constraint with substantial support, at least among the public.[1]
Likewise, leaders like David Stockman, Rand Paul, and Thomas Massie have consistently proposed concrete spending reductions.[2] Think tanks like the Heritage Foundation have published full spending-cut blueprints—for example, their “Blueprint for Balance” report offers detailed proposals across discretionary and mandatory spending categories.[3] The problem isn’t a lack of ideas—it’s a lack of political will. And when the addiction runs this deep, adding more revenue doesn’t promote sobriety—it just buys more drinks.
As an aside, entitlement reform is where the real fiscal reckoning lies. These off-balance sheet liabilities are rapidly becoming on-balance. Means testing, extending age eligibility, and protecting those already relying on Social Security is likely the responsible, principled path forward. But that requires honesty—and the courage to call these programs what they legally are: welfare benefits.[4]
Tariffs Are Taxes—Let’s Not Pretend Otherwise
We can debate whether tariffs are inflationary (and I tend to agree with Dan: they’re not in the strict monetary sense). But they are a tax. Like all taxes, they distort prices, create inefficiencies, and protect the politically connected.
Tariffs rarely stop at revenue. They become vehicles for cronyism. Industries seek shelter, not strength. Consumers pay more, often unknowingly. The economy shifts—not through innovation, but through manipulation.
We may “win” a few trade skirmishes, and no, this isn’t Smoot-Hawley 2.0. But if our goal is genuine economic progress, tariffs risk lowering our standard of living—especially if they mask the real disease: runaway spending.
What Actually Works
Here’s what history supports:
Lower and flatter tax codes
Capital formation and voluntary exchange
A federal government limited to its essential roles
We’ve seen it repeatedly: prosperity isn’t determined by how you collect revenue, but by how much is taken and how little the market is distorted in the process.
History shows that income taxes, even with rate changes, tend to remain a steady share of GDP—an observation often attributed to Hauser’s Law, which suggests that federal tax revenues rarely exceed 19–20% of GDP regardless of marginal tax rates. This pattern is also supported by Congressional Budget Office (CBO) data over the past several decades.[5] What shifts is who shoulders the burden. And corporate taxes—despite political rhetoric—have declined significantly as a share of overall federal revenue, falling from over 10% in the late 1980s to under 7% in recent years.[6] It’s no wonder Washington is eager to find new tools.
The Real Discipline Test
In theory, tariffs could be a more visible and arguably more constitutional source of revenue—if they were replacing something.
But they’re not. And they won’t. Not without structural reform. Not without Congress giving up its favorite excuse: “We just need more revenue.”
Dan and I agree: America needs to get its fiscal house in order.
But the discipline we need won’t come from patriotic branding or populist packaging.
It will come from restraint. From honesty. And from the courage to say no—not just to foreign imports, but to our own worst habits.
Want to talk about how policy changes might affect your financial plan? Reach out—we’d love to help you navigate it.
Want to hear the other side?
Gatewood’s COO, Dan Goeddel makes the case for tariffs as a practical, if imperfect, fiscal tool. [Explore Dan’s View →]
Family Footnote
Fun fact: I had a family member involved in the Boston Tea Party. Contrary to popular belief, it wasn’t about high taxes. It was about removing a tax that gave British tea a price advantage over American-smuggled tea. The rebellion wasn’t over taxation alone—it was over losing an advantage because of taxation. And some things never change.
[2] Rand Paul’s “Festivus” Reports, David Stockman’s works like “The Triumph of Politics,” and Thomas Massie’s repeated bills and votes targeting discretionary spending.
[4] I sympathize with those who say, “I paid into the system.” Many were led to believe Social Security was a personal savings or insurance program. But as the Supreme Court confirmed in Flemming v. Nestor (1960), Social Security is a general welfare benefit—not a contractual right. That doesn’t mean we shouldn’t protect those counting on it, but it does mean we need to be honest about the structure going forward.
The opinions voiced in this material are for general information only and are not intended to provide specific advice or recommendations for any individual.
The economic forecasts set forth in this material may not develop as predicted and there can be no guarantee that strategies promoted will be successful.
This information is not intended to be a substitute for individualized tax advice. We suggest that you discuss your specific tax situation with a qualified tax advisor.
There’s a glaring contradiction in today’s economic discourse, and it clouds the investment outlook. The loudest voices warning about America’s unsustainable federal deficit are often the most reflexive critics of tariffs, an essential tool that could help address the crisis. They demand “fiscal responsibility” but fall silent when asked what they’d cut from the budget. Suggest entitlement reform, and they’ll tell you it’s political suicide. Propose higher income taxes, and they bristle at the economic drag. Ask how they’d raise $2.0 to $2.8 trillion annually to close the federal budget gap, and the conversation ends.
That’s why tariffs—unfashionable, imperfect, and deeply misunderstood—may be one of the only practical tools left that can meaningfully address the deficit until the country is ready for major changes to how the government collects revenue and spends.
D.O.G.E. Promised a Trillion-Dollar Fix. It Delivered a Rounding Error.
The Department of Government Efficiency (D.O.G.E.) was supposed to be the bold solution to government waste. Originally pitched as a vehicle for cutting $1 trillion in inefficiencies, the agency—backed by Elon Musk and restructured under President Trump—quickly revised expectations downward to $150 billion. D.O.G.E. operates as a consultant would, examining costs and structure and recommending changes to achieve efficiencies across various departments.
D.O.G.E. impact is a subject of some debate. As of mid-2025, D.O.G.E. has claimed between $150 billion and $ 90 billion in savings, although independent audits dispute much of that figure. More troubling, aggressive cuts to revenue-generating agencies like the IRS reduced government income. By some estimates, DOGE’s efforts may have cost taxpayers $135 billion through re-hires, overtime, legal settlements, and lost tax collections.
While well-intentioned and fundamentally a good idea, the shortfall was a strategic failure that exposed the limits of the “cut spending” approach. D.O.G.E. aimed to trim fat but ended up delivering a rounding error instead of transformational change.
Growth Alone Won’t Save Us
With a less-than-spectacular D.O.G.E. impact, and large Government spending cuts off the table — at least for now — the bipartisan default in Washington has long been to grow the economy and let increased tax receipts shrink the deficit as a percentage of GDP over time. It’s an appealing theory that consistently fails in practice. Despite periods of strong GDP growth, federal spending continues to outpace revenue by unprecedented margins.
While the growth strategy is politically palatable and will help over time, the U.S.’s current fiscal situation, with annual deficits of over $2 trillion, is dire. We don’t have the luxury of waiting for growth to solve a crisis that compounds daily. Growth matters, but it’s not enough. We need substantial revenue, and we need it soon.
Understanding Tariffs: A Tax, Not Inflation
Let’s address the elephant in the room: tariffs are, in fact, a tax. But they are emphatically not inflation.
Inflation is a monetary phenomenon—the expansion of the money supply that dilutes currency value and drives broad-based price increases. Tariffs don’t expand the money supply or devalue the dollar. They are a targeted consumption tax applied to imported goods, with three key differences from domestic taxes:
Revenue generation: Unlike inflation, tariffs generate federal government revenue, potentially $300 billion annually
Targeted impact: They affect specific imported goods rather than the entire economy. Imports are roughly 15% of the U.S.’s GDP today.
Importer and Corporate absorption possibility: Who absorbs the cost increase from U.S. tariffs is an interesting and complex question, with the absorbing party differing by item and by importer. With energy costs roughly 10% lower than two years ago, many corporations have absorbed most of the tariff costs rather than passing them through
Despite persistent warnings from economists, tariffs have not triggered the runaway inflation they predicted.
The Hidden Costs of Corporate Absorption
However, when corporations absorb tariff costs, the economic impact doesn’t simply disappear—it gets redistributed. Companies facing compressed profit margins from tariff absorption experience a cascade of effects that ultimately flow back to the broader economy:
Reduced profit margins lead to lower corporate earnings, which translate to decreased stock valuations. This creates a diminished wealth effect as portfolio values decline, prompting consumers to reduce spending. Meanwhile, lower capital gains tax revenue partially offsets the government’s gains in tariff income.
This redistribution means that while tariffs may not be directly reflected in consumer prices, their costs still flow through the economy via financial markets and reduced economic activity.
The Regressive Reality of “Targeted” Impact
While tariffs don’t affect every sector equally, describing their impact as merely “targeted” obscures an important truth: if passed through, they disproportionately burden lower-income households. These families spend a higher percentage of their income on goods (versus services), have less flexibility to substitute away from imported products, and are more price-sensitive to increases in everyday items.
This regressive effect means that tariffs could function as a consumption tax that hits hardest those least able to absorb the cost—a significant trade-off that must be weighed against their revenue-generating potential. Kitchen table economics won 2024 for the Republicans, but it could be the reason they lose the 2026 midterm elections.
Why Income Tax Hikes Hit a Wall
One truism of taxes: Anything you tax, you get less of. That reflects human behavior and rational economic actors. Raising income taxes sounds straightforward until you encounter the Laffer Curve’s hard ceiling. Beyond a certain point, higher rates reduce total tax revenue by discouraging work, saving, and investment. Historical data suggests we may already be approaching that point, considering total income taxes collected rose when Trump dropped rates in his first administration.
The federal government’s share of GDP rarely exceeds 20%, regardless of marginal tax rates. Taxing productivity has diminishing returns and penalizes the very economic activity we need to encourage. Tariffs, conversely, are harder to avoid and don’t punish domestic output. For revenue generation with minimal collateral damage to productivity, tariffs offer a superior approach, though they come with their own distributional consequences.
Tariffs as Statecraft: Economic Leverage Without Bloodshed
One of tariffs’ most under appreciated benefits is their geopolitical utility. Unlike sanctions or military action, tariffs exert pressure with fewer human costs and less international conflict.
Consider Canada’s Digital Services Tax proposal earlier this year, which targeted U.S. tech firms. The Trump campaign’s swift threat of retaliatory tariffs prompted Canada to reverse course within days. No troops, no diplomatic standoff—just credible economic pressure accomplishing what traditional diplomacy might have taken months to achieve.
In an increasingly multipolar world where military intervention grows costlier and less popular, tariffs represent a powerful, non-violent tool of statecraft.
The Mainstream Economics Blind Spot
The loudest tariff opposition comes from economists who forecasted a Great Depression during COVID, predicted inflation was “transitory,” and missed nearly every major market rebound of the past five years. Now they’re warning of recession if tariffs increase.
Perhaps they’re right this time. But their track record suggests their models are shaped more by ideological assumptions than empirical evidence. As investors and fiduciaries, we must remain disciplined and objective, recognizing that markets rise under both Democratic and Republican administrations because innovation and capitalism transcend partisan politics.
A Nuanced Approach: Targeted Implementation
Smart tariff policy requires acknowledging both benefits and drawbacks. The mainstream economic consensus identifies legitimate concerns: tariffs can raise consumer prices, potentially trigger trade wars, and may reduce competitive pressure on domestic industries.
The solution isn’t to abandon tariffs but to implement them strategically:
Who are the most inelastic exporters?
What option do they have? Early returns on inflation and the “Liberation Day” April 2, 2025, tariffs reveal higher government revenues and little to no increased inflation or inflation expectations. This result goes against conventional economic groupthink and needs further exploration. One idea is that exporters where trade deficits are large and long running are “inelastic” and as a result have little recourse but to absorb the tariffs if they wish to continue their export volumes.
Target critical industries:
Focus on sectors vital to national security—steel, defense, critical minerals, and advanced manufacturing—rather than blanket applications that raise consumer costs across the board. Tariffs have an additional “incentive impact,” where importers may choose to build plants and manufacture in the U.S., thereby avoiding the tariff cost altogether. This is not a simple calculation for these importers as U.S. production costs could be higher, negating the profitability improvement from moving production to the U.S..
Use as negotiation tools: Follow the US-China Phase One trade deal model, leveraging tariffs to secure better terms while avoiding long-term economic fallout.
Maintain policy clarity: Rapid shifts create business uncertainty that kills investment. Clear, consistent policies allow markets to adapt and plan accordingly.
Match unfair practices: When trading partners engage in dumping or subsidization, targeted tariffs can level the playing field without escalating broader tensions.
Open new markets to U.S. exporters: One of the goals of recent tariff policy has been to open up agricultural markets to U.S. exporters, and this could have a beneficial impact on U.S. agricultural producers and exporters.
The Implementation Gap
However, a significant disconnect appears to exist between this strategic approach and current practice. The administration has largely deployed blanket tariffs across broad categories, including items that the U.S. cannot efficiently produce domestically, such as coffee, bananas, and numerous other products. This approach is a shock-and-awe approach to international trade, and if the intent was to draw everyone’s attention to this issue, the approach succeeded. Unfortunately, this approach creates exactly the problems that strategic implementation could avoid: higher consumer prices on necessities, economic inefficiency from protecting non-strategic industries, and diplomatic tensions without clear negotiating objectives.
This gap between theory and practice undermines many of the arguments in favor of tariffs. The current approach resembles less a surgical instrument and more a blunt tool, impacting the U.S. investment landscape as we saw in the April-May timeframe and making it harder to achieve the revenue and strategic benefits while minimizing economic disruption.
Trump 2.0: Tariffs as Economic Policy
In his first term, Trump deployed tariffs more surgically, targeting China, steel, and automotive sectors. In his second term, tariffs are expected to anchor his economic strategy alongside tax cuts, deregulation, and energy dominance.
The Trump approach may be unpredictable, but it’s not irrational. His focus on significantly altering the terms of U.S. trade across all trading partners can provide near-term economic growth. The mixed stock market performance that we have seen since April 2 creates a dynamic that appears to be high risk, high reward in terms of effective policy implementation. Tariffs can help the Trump administration achieve its objectives. Trump seeks a legacy of bringing industries back to the U.S., delivering on his promises of higher real wages to blue-collar workers, resulting in a booming economy. The question is how far he can take this fundamental restructuring of U.S. trade relations without incurring significant international and domestic opposition.,
Markets Recover From Tariff Shocks
History offers a perspective on tariff-related market volatility. In April 2025, markets dropped 19% on tariff news—eerily similar to December 2018’s 19% decline over trade tensions. In both cases, markets recovered as investors recognized the temporary nature of the disruption. Both recoveries were swift once investors had better visibility into the impact and scope of the tariffs on industries and trading partners.
This pattern suggests markets can adapt to tariff policies more readily than economists predict, especially when those policies generate tangible economic benefits. The chart speaks for itself:
I am proud of the Gatewood Investment Committee and its successful navigation of the market correction this year. On the morning of April 7th, when the market was at its low point for 2025 (easy to see this in hindsight, hard at the time), our CEO said the following to our advisors at our Monday morning all-hands meeting:
“I would keep some powder dry. Since 1957, we’ve had 12 corrections in the S&P 500 greater than 20%. Assuming we’re in a bear market now, half of them were between 20-30%, three were between 30-40%, and another three were greater than 40%. If you have a lot of cash, don’t overcomplicate it. Invest half now, another quarter at a 30% drop, and go all-in, buying everything you can at a greater than 40% drop. You might only get one or two opportunities at that level in your lifetime.”
Since April 7th, the S&P 500 has risen by over +25%. Our clients are the beneficiaries of our continued commitment to long-term, methodical investing on their behalf. That’s the Gatewood way.
The Bottom Line: Tariffs May be the Only Tool We Have Left
We can’t cut our way out of this deficit at least for now, D.O.G.E. proved that. We can’t tax our way out through income taxes—the Laffer Curve won’t allow it. We can’t inflate our way out without destroying the currency. And while growth will certainly help, our fiscal situation requires exploration of all possible revenue sources.
That leaves tariffs as one of our most viable short-term options for meaningful deficit reduction until the country is ready for major changes to how the government collects revenue, what services it provides its citizens, and the cost of those services.
Tariffs have the potential to generate substantial revenue, though with significant distributional consequences. Tariffs create geopolitical leverage. Tariffs can strengthen strategic industries when properly targeted. The impact of tariffs may fall unequally on exporters, importers, nations, and consumers. They offer a possible path to start closing the deficit before it reaches crisis levels.
The key is honest acknowledgment of their costs and who absorbs these costs: the regressive burden on lower-income households if passed through, the hidden effects of corporate absorption flowing through financial markets, the impact on exporters and importers, and the critical importance of strategic rather than blanket implementation.
You don’t have to love tariffs to recognize their potential impact as a bridge solution until the country is ready for significant changes to how the government collects revenue and spends. At this point, they represent one of the only tools with a credible shot at improving our fiscal trajectory before time runs out, provided we implement them thoughtfully rather than as a blunt instrument.
The deficit is the fire. Tariffs are the hose. But we need to aim carefully, or we risk dousing the wrong things while the real problem continues to burn.
The opinions voiced in this material are for general information only and are not intended to provide specific advice or recommendations for any individual. All performance referenced is historical and is no guarantee of future results. All indices are unmanaged and may not be invested into directly.
Investing involves risk including loss of principal. No strategy assures success or protects against loss.
The economic forecasts set forth in this material may not develop as predicted and there can be no guarantee that strategies promoted will be successful.
This information is not intended to be a substitute for individualized tax advice. We suggest that you discuss your specific tax situation with a qualified tax advisor.
There is no guarantee that a diversified portfolio will enhance overall returns or outperform a non-diversified portfolio. Diversification does not protect against market risk.
The S&P 500 Index is a capitalization-weighted index of 500 stocks designed to measure performance of the broad domestic economy through changes in the aggregate market value of 500 stocks representing all major industries.
On July 7, 2025, the “One Big Beautiful Bill,” a major tax and spending package we’ve been closely tracking, was officially signed into law by the President. We’ve broken down the new changes to help you easily understand how this might affect you, your family, and your financial plans.
What’s in the Final Law?
Permanent Lower Taxes for Individuals
Good news! Lower tax rates and the bigger standard deduction that came from the 2017 tax law (often called the TCJA) are now permanent. This means most people will continue paying less in taxes long-term.
Increased SALT Deduction Cap
If you live in a state with higher taxes, you’ll appreciate this one: The deduction limit for state and local taxes (SALT) has increased from $10,000 to $40,000. However, this benefit phases out if your income is above $500,000.
Special Deductions for Workers and Seniors
No Federal Tax on Tips and Overtime: Workers who rely on tips or overtime pay won’t pay federal taxes on these earnings between 2025 and 2028, as long as income stays under certain limits ($150K individual/$300K family).
Extra Deduction for Seniors: If you’re 65 or older, you’ll get an extra deduction ($6,000 if single, $12,000 if married), helping reduce or eliminate taxes on Social Security and other income. This deduction phases out at higher income levels.
Estate Tax Exemption Increase
The exemption for estate taxes is now permanently set at $15 million per person, helping families pass more of their wealth to their heirs without tax penalties.
Good News for Business Owners
Bonus Depreciation: If you’re investing in your business, you’ll be able to write off 100% of qualifying expenses immediately (from 2025–2029).
Section 179: Small business owners can now immediately expense up to $2.5 million of equipment, helping with cash flow.
Research and Development: If your business invests in research, new rules let you write off these expenses more easily through 2029.
QBI Deduction: The 20% deduction for pass-through business income is now permanent, and it phases out gradually for high earners, rather than disappearing all at once.
Energy and Community Investments
Clean-energy tax credits are being reduced, but you can still access some incentives for solar and electric vehicles under stricter rules.
Opportunity Zone investments continue, especially encouraging investment in rural and underserved communities.
Families and Children Benefit Too
A new “Trump Savings Account” allows families to contribute up to $1,000 per year per child born after 2024, offering tax-friendly growth potential.
Child tax credits have increased, providing additional support for families.
Social Program Changes
There are new, stricter work requirements for Medicaid and SNAP (food stamps). While this is intended to encourage employment, it may affect some families negatively.
What Did NOT Pass?
The corporate tax rate stays at 21%. It was not reduced to 15% as previously proposed.
The estate tax was not eliminated, just increased significantly.
Taxes on Social Security benefits were not completely removed, although many seniors will effectively see little to no tax on their benefits due to the senior deduction.
Who Benefits, and Who Might Face Challenges?
Winners:
Middle-income households due to lower taxes and increased deductions.
Small and medium-sized business owners with more tax incentives.
Families who can use the higher estate exemptions.
Seniors benefiting from additional deductions.
Families with young children through new savings opportunities.
Those Facing Challenges:
Higher earners in high-tax states due to limited SALT benefits.
Consumers and businesses involved in renewable energy due to fewer incentives.
Lower-income households impacted by stricter Medicaid and SNAP requirements.
We understand that these changes might have mixed impacts depending on your situation. Our priority is making sure you have a clear, easy-to-follow plan.
How Gatewood Wealth Solutions is Here for You
We’re already working to help our clients:
Understand exactly how these changes impact your unique situation.
Adjust your strategies to make the most of new opportunities.
Seek to ensure you’re well-prepared and protected from unintended consequences.
As always, please reach out to us if you have questions or would like personalized advice on navigating these new changes. We’re here to guide you every step of the way.
[Original Article from 06/03/2025]
On May 22, 2025, the U.S. House of Representatives narrowly passed a nearly $4 trillion tax bill known as the “One Big Beautiful Bill” by a 215-214 vote. The legislation includes the most significant tax changes proposed since 2017, including permanent extensions of key provisions from the Tax Cuts and Jobs Act (TCJA), new deductions, and revised rules for both individuals and businesses.
While this is a major step, it is not yet law. The bill now heads to the Senate, where changes are likely. The administration has signaled an interest in seeing legislation finalized by July 4, though many expect the timeline may extend into August or beyond, depending on the pace of negotiations.
Here’s what you need to know — and what we’re doing to help you prepare.
Key Highlights from the House Bill
For Individuals:
Permanent extension of TCJA provisions, including lower individual tax rates, an expanded standard deduction, and repeal of personal exemptions.
Increased child tax credit to $2,500 per child for tax years 2025 through 2028.
Higher SALT deduction cap, raising the limit from $10,000 to $40,000 for households earning under $500,000, with the cap and income threshold indexed by 1% annually through 2033.
New above-the-line deductions for seniors ($4,000), tip income, overtime pay, and up to $10,000 in U.S. auto loan interest—each subject to income limits.
Estate Planning Updates:
Increased lifetime exemption for estate, gift, and generation-skipping transfer taxes to $15 million starting in 2026, indexed for inflation. This builds on the existing TCJA levels, which reach nearly $14 million in 2025.
For Business Owners:
Bonus depreciation restored at 100% for qualifying assets placed in service between 2025 and 2029.
Section 179 expensing limits increased to $2.5 million, with a $4 million phaseout threshold.
Domestic R&D expensing reinstated for 2025 through 2029 under a new Section 174A structure.
Section 199A (Qualified Business Income Deduction):
Deduction rate increased from 20% to 23% starting in 2026.
Phaseout reform: For service businesses, it expands eligibility and the deduction phases out gradually—reducing by 75 cents for each dollar of income over the threshold—making planning more predictable and makes the deduction permanent. (I removed the comma in this sentence.)
Expanded eligibility: Certain dividends from Business Development Companies now qualify for the deduction.
Permanence: The deduction is made permanent, ending its previous 2025 sunset.
Other Notables:
Energy credit repeals and phaseouts: The legislation rolls back tax credits from the Inflation Reduction Act, affecting wind, solar, and battery storage projects, and potentially increasing household energy costs.
Opportunity Zone extension through 2028, with new incentives for rural investment.
International and reciprocal taxes, including changes to GILTI, FDII, BEAT, and new retaliatory taxes for countries imposing “unfair” taxes on U.S. firms.
Medicaid & SNAP Changes: The bill imposes stricter work requirements for Medicaid and the Supplemental Nutrition Assistance Program (SNAP), potentially affecting millions of low-income Americans.
Introduction of “Trump Savings Accounts”: The bill creates $1,000 “Trump savings accounts” for children born after 2024, offering tax-deferred savings with capital gains tax rates on withdrawals.
Student Loan Forgiveness Repeal: The legislation repeals student loan forgiveness options under President Biden’s SAVE plan and introduces new repayment plans.
Defense & Border Security Funding: The bill allocates $150 billion to defense spending and $70 billion to border security, including funding for mass deportations and border infrastructure.
What Happens Next?
The Senate is expected to take up the bill in June, possibly bypassing committee review in favor of direct negotiations. Any significant changes made by the Senate would require another vote in the House before the bill can be enacted. While many core elements of the bill enjoy broad Republican support, there are competing priorities among Senate members — particularly around energy credits, international taxation, and the scope of permanent provisions.
How Gatewood Is Preparing Our Clients
With major tax changes on the horizon and year-end planning season approaching, timing and strategy will be critical. At Gatewood Wealth Solutions, we’re preparing our clients for all possible outcomes — and we’re starting now.
Here’s how we’re helping:
Running personalized tax scenarios under both current law and the proposed changes, so you can make informed decisions now — not after the fact.
Identifying strategic opportunities to leverage new deductions, avoid phaseouts, and optimize entity structures and income timing.
Reviewing estate and business plans to take advantage of proposed changes, including the increased estate exemption and favorable treatment of business investments and income.
You don’t need to wait for the final vote to start planning. Strategic action today can create lasting benefits regardless of how the final bill takes shape.
If you’re ready to review your plan or want to understand how this legislation could impact your financial goals, let’s talk. We’re here to guide you through it — with clarity, strategy, and purpose.
Important Disclosures:
The opinions voiced in this material are for general information only and are not intended to provide specific advice or recommendations for any individual.
This information is not intended to be a substitute for individualized tax advice. We suggest that you discuss your specific tax situation with a qualified tax advisor.
“This Time it’s Different.”
The markets have given us a lot to digest lately. From shifting tariffs under the Trump administration to Elon Musk’s influence on the rise (and rollercoaster) of DOGE, plus rapid changes in federal policies—uncertainty has been the dominant theme. And if there’s one thing markets hate, it’s uncertainty. But while the headlines may suggest that “this time is different,” we’re reminded again that history often tells a reassuringly familiar story: this too shall pass.
The Uncertainty Factor
We’re seeing how quickly investors react to potential trade wars, personnel shifts, and talks of cutting wasteful or fraudulent spending. When so many unknowns hit at once, markets struggle to price it all in. Yet history reminds us that markets have weathered many storms before.
When COVID-19 first struck, markets plummeted before recovering in record time. That tells us something about how investor psychology works: once the most severe unknowns become known—even if they’re negative—markets tend to re-price and move on.
A Look at Recent Volatility
In order to put the current volatility in context, consider the COVID-19 crash.
Worst days since 2020:
March 16, 2020: -11.98%
March 12, 2020: -9.51%
March 9, 2020: -7.60%
Best days since 2020:
March 24, 2020: +9.38%
March 13, 2020: +9.29%
March 26, 2020: +6.24%
In just 33 days, from February 19 to March 23, 2020, the S&P 500 fell 33.9%—a truly historic plunge. Yet, by August 18, 2020, barely six months later, the index had fully rebounded, even though the world was far from normal.
What changed? By March 23, the uncertainty about global shutdowns was, to some degree, factored in. The market had enough information to price the situation and begin its climb.
Perspective Through History
Since 1980, the S&P 500 has had an average intra-year drop of 14%. That means, in any given year, you can expect some sharp swings. Despite these drawdowns, the index still finished positive in 34 of the last 45 years.
Yes, tariffs can rattle short-term confidence. Yes, DOGE hype can come and go. Yes, federal cuts can spark anxiety. But these are just the latest in a long history of events that cause market volatility. Historically, markets have proved resilient in the face of everything from recessions to pandemics and they tend to reward disciplined investors over time.
The Power of Diversification
The current landscape also underscores why diversification is critical.
International holdings are significantly outperforming U.S. stocks this year.
Value stocks have been outpacing growth stocks.
Fixed income offers yields comfortably in the 4% range, providing stability amid the market’s daily fluctuations.
If you’re only invested in a narrow slice of the market, you feel every bump. A well-diversified portfolio, on the other hand, can help cushion the ride when uncertainty hits.
Staying Disciplined in Uncertain Times
As the news cycle churns, it’s easy to think, “This time is different.” But if recent history has taught us anything, it’s that overreacting to short-term market swings can often do more harm than good.
Volatility is part of the investing journey.
Uncertainty is inevitable.
Long-term perspective usually wins the day.
Whether the market is panicking over tariffs, new technologies, or dramatic fiscal changes, remember that reacting out of fear can lock in losses and undermine the very reason we invest: to grow our wealth over time.
The Bottom Line
Market uncertainty is never comfortable, but it’s not new. We’ve seen swift downturns before, and we’ll see them again. Historically, markets reward those who stay focused on their goals rather than getting caught up in the headlines.
When uncertainty is high, it helps to revisit your investment plan, lean on diversification, and keep a steady hand on the wheel. While the players and policies may change from one administration to the next, what remains is the market’s ability to adapt and recover, often more quickly than we expect.
In other words: this too shall pass.
Important Disclosures:
The opinions voiced in this material are for general information only and are not intended to provide specific advice or recommendations for any individual. All performance referenced is historical and is no guarantee of future results. All indices are unmanaged and may not be invested into directly.
Investing involves risk including loss of principal. No strategy assures success or protects against loss.
The economic forecasts set forth in this material may not develop as predicted and there can be no guarantee that strategies promoted will be successful.
There is no guarantee that a diversified portfolio will enhance overall returns or outperform a non-diversified portfolio. Diversification does not protect against market risk.
The S&P 500 Index is a capitalization-weighted index of 500 stocks designed to measure performance of the broad domestic economy through changes in the aggregate market value of 500 stocks representing all major industries.
Securities and advisory services offered through LPL Financial, a registered investment advisor, Member FINRA & SIPC.
Introduction
Tariffs have long been a powerful but controversial tool in economic policy, influencing trade balances, industry growth, and global relations. While tariffs are often used to protect domestic industries and jobs, they can also increase costs, disrupt supply chains, and provoke retaliatory trade measures.
With President Donald Trump proposing new tariffs in his second term, it is critical to examine the potential economic benefits and consequences of these policies.
How Tariffs Work & Why Politicians Use Them
A tariff is a tax imposed on imported goods, making them more expensive and giving domestic industries a competitive edge. Governments justify tariffs for several reasons:
✔ Protecting Domestic Industries – Shields local businesses from cheaper foreign competitors.
✔ Reducing Trade Deficits – Encourages domestic consumption over imports.
✔ Leverage in Trade Negotiations – Used as a bargaining tool in international trade deals.
✔ Revenue Generation – Provides direct tax revenue to the government.
President Trump previously implemented tariffs as part of his “America First” trade policy. In his second term, he has proposed tariffs on imports from Canada, Mexico, and China, as well as reciprocal tariffs to match the duties imposed on U.S. goods by other countries.
While these measures aim to strengthen U.S. industry, they also carry potential risks, including higher consumer prices and trade retaliation from global partners.
The Pros & Cons of Tariffs: Who Wins and Who Loses?
✔ Potential Benefits of Tariffs
Job Protection & Domestic Growth – Industries like steel, textiles, and technology benefit from reduced foreign competition.
Stronger Local Manufacturing – Encourages companies to reinvest in U.S. production rather than outsourcing.
Negotiation Leverage – Tariffs pressure foreign nations to renegotiate trade agreements that benefit American businesses.
Short-Term Gains for Farmers & Key Sectors – Temporary relief from low-price competition abroad.
Example: U.S. steel tariffs helped boost domestic production but raised costs for automakers and construction firms.
❌ The Negative Effects of Tariffs
Higher Costs for Consumers – Businesses pass tariff costs onto consumers, raising prices for food, electronics, and automobiles.
Inflationary Pressures – Tariffs increase overall inflation, leading to higher interest rates and slowing economic growth.
Retaliatory Tariffs Hurt U.S. Exports – Countries like China and the EU respond by targeting American industries (e.g., soybeans, whiskey).
Disruptions to Global Supply Chains – Industries reliant on imported raw materials (e.g., automotive, tech, and manufacturing) face higher costs and production delays.
Example: The U.S.-China Trade War (2018-2020) led to higher prices on imported goods, costing the average American household $1,277 per year.
Impact on Inflation & Global Trade
One of the biggest risks of tariffs is inflation. As tariffs increase the cost of imported goods, companies pass these expenses to consumers, raising prices across the economy.
❌ Long-Term Effects: Persistent inflation pressures force the Federal Reserve to raise interest rates, slowing investment and job growth.
Globally, tariffs disrupt trade flows as companies shift production to countries with lower trade barriers. Nations impacted by U.S. tariffs may form alternative trade agreements, reducing American influence in global markets.
Example: After U.S. tariffs, China increased soybean imports from Brazil, permanently reducing U.S. market share.
Are Tariffs a Sustainable Economic Strategy?
✔ When Used Selectively: Tariffs can protect key industries and pressure foreign nations into fairer trade deals.
❌ Overuse Leads to Economic Slowdowns: Broad tariff policies raise costs, fuel inflation, and trigger global trade conflicts.
With President Trump’s proposed second-term tariffs, policymakers must carefully weigh short-term benefits against long-term risks. If implemented without strategic adjustments, tariffs could exacerbate inflation and slow economic recovery.
Conclusion: Finding a Balanced Trade Approach
Rather than relying solely on tariffs, the U.S. could consider:
✔ Trade Agreements that Promote Fair Competition (e.g., stronger deals with allies).
✔ Tax Incentives for Domestic Manufacturing (instead of penalizing imports).
✔ Investments in Workforce Development & Technology (to make U.S. industries more competitive globally).
Ultimately, tariffs should be used as a precise tool, not a broad economic policy. While they can shield domestic industries, their long-term costs—higher prices, inflation, and trade retaliation—must be carefully managed.
What’s Next?
As the Trump administration considers new tariffs, businesses and consumers should prepare for potential price increases, supply chain adjustments, and shifts in global trade dynamics. The key to long-term economic success lies in balancing protectionist policies with sustainable growth strategies.
Tariff Impacts: Positives and Negatives.
The table below outlines the potential positive and negative impacts of tariffs across various industries and countries. While tariffs can provide benefits such as protecting domestic industries and increasing government revenue, they also introduce challenges such as higher consumer prices, trade disruptions, and economic slowdowns.
Industry/Country
Positive Impact
Negative Impact
U.S. Steel & Aluminum
Higher domestic production, protection from foreign competition
Higher material costs for automakers, increased consumer prices
U.S. Agriculture
Temporary price relief for farmers, government subsidies
Retaliatory tariffs reduced exports, financial losses for farmers
U.S. Manufacturing
Encourages local production, protects jobs, less foreign competition for domestic manufacturers
Higher costs for raw materials, reduced global competitiveness
Technology Sector
Incentive to develop domestic semiconductor chip production
Increased prices for electronics, supply chain disruptions
Retail & Consumer Goods
Potential growth and support for U.S. textile industry
Higher prices for consumers, inflation risk
China
Encourages domestic consumption, reduced reliance on U.S. imports
Export losses, reduced access to U.S. markets
European Union
Increased protection for local businesses due to reduced U.S. imports
Tariffs on U.S. goods led to retaliatory measures, trade disruptions
Mexico & Canada
Possible renegotiation of trade agreements
Reduced trade volumes with U.S., higher import costs
Vietnam & Southeast Asia
New manufacturing investments, as companies seek tariff-free production
Gains at the expense of traditional U.S. trade partners
U.S. Government Revenue
Increased tax revenue for the government from tariffs
Economic slowdown from reduced trade
Important Disclosures:
The opinions voiced in this material are for general information only and are not intended to provide specific advice or recommendations for any individual.
Investing involves risk including loss of principal. No strategy assures success or protects against loss.
This information is not intended to be a substitute for specific individualized tax or legal advice. We suggest that you discuss your specific situation with a qualified tax or legal advisor.
Securities and advisory services offered through LPL Financial, a Registered Investment Advisor, Member FINRA/SIPC
The economic forecasts set forth in this material may not develop as predicted and there can be no guarantee that strategies promoted will be successful.
Black Friday and Cyber Monday are great times to find amazing deals, but they’re also a prime time for scammers. While you’re hunting for bargains, stay alert to avoid getting caught in a scam. Here are some common tricks to watch out for so you shop safely.
Fake Websites
Sometimes a scammer may send an email with a link to a fake website that looks like a real store. Before you buy anything, check the address bar. Many scam websites use extra letters in the URL or a capital “I” instead of an “L.” For example, WaImart.com (with a capital “I”) is almost indistinguishable from Walmart.com (with a lower-case “L” appearing as “l”). These may be hard to spot, so if in doubt, use a free URL checker like Google’s Safe Browsing. Also look at the beginning of the web address; a secure web address begins with “https.”
Too-Good-to-Be-True Deals
If something sounds too good to be true, it probably is. Scammers frequently offer dirt-cheap prices on brand-name electronics or popular shoes, etc. Stay alert; compare prices with competing stores. If one site has a product for a fraction of what everyone else is offering, you’re probably being ripped off.
Fake Order Confirmations
Beware of any email that tells you that you ordered something that you didn’t. These emails try to make you panic and click a “cancel order” button. If you are at all in doubt about whether you ordered something, check your accounts directly through the store’s website.
Gift Card Scams
Gift cards make ideal holiday presents, but sometimes they may be risky. Scammers might try to sell you worthless or stolen gift cards, so buy them only from trusted stores. Never buy electronic gift cards listed for sale on online markets, or from people or entities outside a retailer’s normal distribution channels.
Shipping Scams
Shipping scams are common at this time of year. Perhaps you’ll get a message that an item is having trouble being delivered and you should pay a fee by mailing a check or by providing some personal information. Always track shipments directly from the store or the delivery company’s website.
Social Media Scams
You may get a pop-up on your social media feed advertising a huge discount code. It might be fake. Do your homework before clicking on a link or buying anything, especially if it is from a brand you aren’t familiar with.
Fake Reviews
Scammers may leave fake reviews designed to improve the perception of their item’s quality. When looking up reviews, be discerning. Most reviews should be mixed: some good, some bad. A “perfect” rating or nothing but glowing reviews might be a red flag.
Limited Time Offers
Scammers may tell you that it’s your only chance, that the deal won’t last. They are counting on you to make an impulse purchase. DON’T. Instead, go online and see if the deal is real.
By staying alert and following these tips, you may enjoy the holiday deals without falling for a scam. Stay safe and happy shopping!
Important Disclosures:
The opinions voiced in this material are for general information only and are not intended to provide specific advice or recommendations for any individual.
All information is believed to be from reliable sources; however, LPL Financial makes no representation as to its completeness or accuracy.
Gatewood Investment Committee
Christopher Arends, CFA®, CMT®, CAIA®
Aaron Tuttle, CFA®, CFP®, CLU®, ChFC®
Jerry Pan, MSA
Calvin Racy
INTRODUCTION
If you’ve followed politics for any length of time, you’ve heard it all before: “This is the most important election in history.” Or, “It’s different this time.” These phrases are part of the cycle, resurfacing every few years. Just last week, our preferred custodian, LPL Financial, echoed the sentiment with a blog titled “This Time Will Be Different.”
Maybe they’ll be correct, but we doubt it.
POLICY SHIFTS & MARKET RESILIENCE
Yes, policy changes are inevitable. If the Democrats have a strong showing, we will see higher taxes. Their proposals mostly fall within the historical range for tax brackets and aren’t entirely new for markets or taxpayers. Sure, higher taxes will pressure corporate profits, but resilient companies have shown they can weather these shifts and generate growth.
Consider Alphabet (Google’s parent company), which reported 15% revenue growth last week. Democrats often push for breaking up Big Tech over anti-trust concerns, while Republicans challenge their censorship policies. However, Alphabet remains resilient, growing profits and making prudent investments regardless of which party is in power. Strong businesses can navigate through regulatory pressures and continue to reward shareholders.
WHAT CAN WE EXPECT?
Markets dislike uncertainty, and the weeks leading up to an election often bring plenty of it. Historically, election years bring October volatility as markets brace for uncertainty, frequently followed by a rebound in November and December when outcomes become increasingly certain.
In the short term, we may see markets react by favoring specific market factors, such as certain Sectors (Financials vs. Technology), Size (Large vs. Small Cap), or Geographies (Domestic vs. International Developed and Emerging Markets), depending on the anticipated policy impacts of the winning party. In the long term, politics will be noisy, and allocating to good businesses at a fair price has always won.
FINAL TAKEAWAY: HISTORICAL MARKEY TRENDS & OPPORTUNITY
We’ve been showing election slides all year, and here’s the recurring theme: markets tend to rise over time, regardless of whether a Democrat or Republican is in the White House. Gridlock, which remains a probable outcome, has been the preferred outcome for stock market returns. In any case, opportunities will exist under all outcomes. Regardless of the outcome, we’re always prepared to identify and act on those opportunities. We’ll close with perspective from Dave Ramsey “What happens at your house is a whole lot more important than what happens in the White House.”
The opinions voiced in this material are for general information only and are not intended to provide specific advice or recommendations for any individual.Investing involves risk including loss of principal. No strategy assures success or protects against loss. There is no guarantee that a diversified portfolio will enhance overall returns or outperform a non-diversified portfolio. Diversification does not protect against market risk.
The more assets you have at stake, the bigger the target on your back for cybercrime. This means that managing your financial wealth needs to go beyond traditional security measures. You also need a comprehensive cybersecurity strategy. Here are some risks for high-net-worth individuals and how to manage them.
Understanding the Risks
Phishing and Spear Phishing Attacks
HNWIs may be targeted by personalized messages sent by cybercriminals in an attempt to capture sensitive information. For example, you may receive a message supposedly from a loved one letting you know they’re traveling and had their passport stolen or were arrested and are in jail. They may ask you to wire them money without letting others know.
Ransomware
The term ransomware describes malicious software that may cause your information to become inaccessible unless you pay a fee. Unfortunately, if you fall victim to a ransomware scam, you may lose your data and money. Once you’ve given the criminals money to release your data, they may continue requesting money until you stop responding.
Identity Theft
If criminals have information, like your date of birth, mother’s maiden name, and Social Security number, they may impersonate you easily. Identity theft lets criminals access your bank accounts, investments, and other assets held in accounts that are accessible online. They may then send these assets to offshore accounts, which are more difficult to recover.
Key Cybersecurity Strategies
To manage your wealth and personal information, consider some of the following cybersecurity strategies.
● Advanced Authentication Methods: Always implement multifactor authentication (MFA) for your financial accounts wherever possible. You might also use biometric authentication methods, like fingerprints or facial recognition.
● Secure Your Devices: Make sure every smartphone, tablet, and computer has the most current antivirus software installed. Also, enable automatic updates to keep your software and applications up-to-date.
● Network Security: Set up a virtual private network (VPN) when you go online, especially if you’re connected to public WiFi. Put firewalls and intrusion detection systems in place to manage your home and business networks.
● Monitor Financial Transactions: Regularly review account statements and transactions, looking for any unusual or unauthorized activity.
By using these practices, you might get ahead of the game when managing the impacts of cybercrime.
Important Disclosures:
Content in this material is for educational and general information only and not intended to provide specific advice or recommendations for any individual.
This article was prepared by WriterAccess.
LPL Tracking # 609848
For those unfamiliar with the “baby boom,” it is the period that stretches from 1946 to 1964, children born at the tail end of the trials and tribulations of World War II right up to the start of the Vietnam War. It is true that baby boomers are working longer than before; however, as they retire, the impact may be noticeable across the economy.
As baby boomers retire and leave the labor force, their departure could impact the economy in several ways, including:
· Productivity rates could decrease
· There could be a shortage of workers
· The costs associated with an aging population may put a strain on the economy
· Their exit may create a “talent gap” as decades of industry experience go out the door with them.
Despite the uncertainties of the economic future, baby boomers with retirement on the horizon are not sitting idle. They are taking proactive steps to prepare for this new phase of life. Here are a few measures they are implementing:
1. Postponing their retirement
It is becoming more common for baby boomers to put off retiring for a few years to put a little bit more money away. The uncertain economic landscape leaves many wary of how long their money can stretch if faced with unforeseen financial surprises like a recession or depression, consistently rising cost of living, and high interest rates.
2. Create a retirement spending budget
One way of managing your spending in retirement is to determine how much you could have on the date you want to retire. Then, determine how much you can comfortably spend versus your household income after you stop working, such as Social Security benefits, your pension (if you get one), withdrawals from a retirement account, and any other sources of income. You have a number that for your future expenses, you can focus on working toward a lifestyle where you can make that work, for example, downsizing and reducing expenses like utilities, lawn service and landscaping, excessive HOA fees, and more.
3. Review your investment portfolio
As you near retirement, there is a good chance you will have a nest egg built up. You may have a significant amount of that money in a traditional savings account, for example, but you have been interested in something that provides a higher interest rate. Consider reviewing your investment portfolio and modifying it if necessary in pursuit of your financial goals. There is no guarantee that you will earn the returns you anticipate, as all investments have risk.
4. Establish an emergency fund if you don’t have one
It is impossible to predict the future and medical care for people after retirement can be expensive. Having an emergency fund and cash available when needed can help mitigate the risk of insufficient money to cover costs such as medical events. According to Bankrate, more than 1 in 5 Americans have no emergency savings. An estimated one in three had some emergency savings but not enough to cover three months of expenses.
5. Consulting with their financial professional
Nearing retirement can be stressful, especially during uncertain times with a perceptively unstable economy. Whether you feel confident that you saved up enough over the course of your working years or not, consider consulting a financial professional to help you redesign your retirement and savings strategy and stay aligned with your long-term goals.
Important Disclosures
The opinions voiced in this material are for general information only and are not intended to provide specific advice or recommendations for any individual.
All information is believed to be from reliable sources; however, LPL Financial makes no representation as to its completeness or accuracy.
This article was prepared by LPL Marketing Solutions
LPL Tracking # 577572
Aaron Tuttle, CFA®, CFP®, CLU®, ChFC
GWS Chief Investment Officer
Are we on the verge of a recession? That seems to be the number one question on all investors’ minds. In this quarterly market summary, we’ll take a deep dive into this and other key market themes from Q1 2022. As always, we’re here to give you actionable advice so you can make informed decisions with your money.
Theme #1: Recession Signals Historically, one of the most accurate predictors of a coming recession has been an inverted yield curve — exactly what we’re experiencing in the market today. Typically, the yield curve is upward sloping. When it inverts, it signifies that short-term debt vehicles have higher yields than similar long-term instruments. As we always take care to mention, no one has a crystal ball to know what the market will do. Still, having kept an eye on the yield curve and other economic factors, our investment committee anticipates we are approximately six months out from a recession.
Theme #2: Markets Moving Past Headlines Given the Ukraine-Russia war, it’s easy to blame Russia for inflation. In reality, monetary policy, lockdowns, and other government policies laid the groundwork for inflation long before the war. Inflation will continue on as supply chains become less global and more regional. The markets are already moving past their initial reaction to the Ukraine-Russia War (even if the headlines have not). Instead, markets seem to be reacting more acutely to changes in Federal policy.
We’ve seen strong unemployment numbers in the last few weeks. Even if we have a recession, we could see unemployment staying low. Real wages are likely to drop through this, and companies will be more hesitant than before when it comes to letting people go. Instead of seeing more employees laid off, we anticipate a rise in the cost of energy, food, and other consumable goods.
So, What Does This Mean for My Portfolio?
Many clients have asked, “If we’re heading into a recession, should I pull out of the market now and go to cash?”
Our answer is: Not necessarily. There is still value to be had in equities, and completely pulling out causes you to miss the chance for those potential gains. Plus, with high inflation, you also risk losing your principal if it’s not growing at all.
The market typically peaks 13 months after an inverted yield curve happens. So, we need to be more diligent and ready to move on things. It makes more sense to look at more defensive equities than to complete sidestep into cash.
Conclusion
From an inverted yield curve to the Ukraine-Russia war and unemployment metrics, there’s plenty to keep an eye on as we head into Q2. We don’t anticipate that the recession will hit this quarter; however, it’s prudent to be prepared and review your portfolio strategy with your advisor if you have any questions.
Our Commitment
As always, the GWS Investment Committee is committed to the following investment management goals for our clients in 2022:
To pursue long-term returns that first and foremost strive to help clients work toward all goals in their financial plans.
2. To seek excess return above each portfolio’s benchmark over a three-year trailing time period and a full market cycle, in order to hopefully cover client fees and add surplus to their portfolios.
3. To implement investment strategies that align with each client’s personal volatility and benchmark sensitivity to help them remain confidently invested and long- term focused. We’ll continue to provide updates on these and other market happenings, so be sure to subscribe to our YouTube channel so you never miss a Weekly Market Insight webinar (Wednesdays at 3:30 p.m. CT). We’ll see you there! —
Disclosures
The opinions expressed are those of Aaron Tuttle and Gatewood Wealth Solutions as of the date stated on this material and are subject to change. There is no guarantee that any forecasts made will come to pass. This material is for general information only. This material does not constitute investment advice and is not intended to endorse any specific investment or security.
Please remember that all investments carry some level of risk, including the potential loss of principal invested. Indexes and/or benchmarks are unmanaged and cannot be invested directly. Returns represent past performance, are not a guarantee of future performance, and do not indicate any specific investment. Diversification and strategic asset allocation to not assure a profit or protect against loss.
When interest rates rise with fixed income securities and bonds, bond prices usually fall, because an investor may earn higher yield with another bond. Moreover, the longer the maturity of a bond, the greater the risk. When interest rates are at low levels, there is a risk that a significant rise in interest rates can occur in a short period of time and cause losses to the market value of any bonds that you own. The bond’s issuer is obligated to return the investor’s principal (original investment). As a result, high-yield bonds present greater credit risk than bonds of higher quality. Bond investors should carefully consider interest rate risk, credit risk, liquidity risk, securities lending risk, repurchase, and reverse repurchase transaction risk.
Securities and advisory services offered through LPL Financial, a registered investment advisor, Member FINRA & SIPC.
Welcome to our GWS quarterly summary and 2022 outlook. Each quarter, we review final market numbers and data to reflect on key events and share our insights with our clients and community. As always, we’re here to give you actionable advice so you can make informed decisions with your money.
If you’re a subscriber to the Weekly Market Insight webinars my colleague Chris Arends and I host every Wednesday at 3:30 p.m. CT, you know we like to stick to a few key themes to update each week. Let’s start by reviewing our 2021 themes and see where they landed — as well as where we see each heading in 2022.
2021 Recap: As predicted, Covid-19 hung around in the spring, wreaking havoc on the market. After that, the market largely ignored it — and I think I speak for everyone in saying that the pandemic is hopefully behind us. The virus remains with us, but as the susceptible population drops, the severity of the outbreaks declines. 2022 Predictions: This is likely Covid-19’s last year as a market-moving threat.
The omicron strain is less severe and more transmittable than alpha, and the susceptible population is declining. This virus is unlikely to continue as political movement, as it is perceived to cost the democrats in polls and recent elections.
2021 Recap: Early last year, we said central banks would be accommodative and might be the only game in town. Central banks certainly were accommodative, but you could make an argument that there are lots of ways of thinking and infrastructure available to build out that accommodative strategy. We had anticipated the Georgia runoff election would be another major player in the monetary policy game; however, without the full Build Back Better Bill passing, it didn’t have much of an impact. Monetary Policy
That leaves the question, do we think Congress will try to scale down the rest of the rest of the bill and get it passed? Absolutely — politicians love spending! But the focus of the bill will likely change, largely due to the burgeoning power of populism.
Speaking of populism, this “people over the elite” stance toward politics is quickly gaining ground. Just ask New Jersey’s longtime state Senate president, Democrat Steve Sweeney. Last year, he handily lost to a new candidate, Edward Durr, who spent just $153 on his campaign — but had an R at the end of his name in a very blue area of the country. I am sure this concerns democrats, as many are not seeking reelection.
2022 Predictions:
As you can imagine, democrats are getting concerned about what this year’s election will look like. They’re thinking, “How can I prevent a red wave — or at least prevent it from taking me out?” That’s where the focus will be going into the new year.
We’re also predicting that central banks will be forced to tighten monetary policy to maintain credibility, as inflation remains elevated 6-8% (before moderating late Q4 ~4%). There are still three pending rate hikes closing 2022 at 0.75-1% of the Target Fed Fund Rate.
2021 Recap: Let’s talk domestic economy. We saw about 4.5% growth1 this year, which is somewhat to be expected considering the amount of money the Fed poured into economy. We also experienced significant inflation, which was not a surprise to us at GWS, but was a surprise the market. Many people believed inflation would be transitory. After all, the Fed did a lot of money printing in 2008, and inflation hasn’t been around for decades.
However, some of the forces that were at play then have weakened in present day, especially in the labor market. We’ll discuss this in further depth during a future Weekly Market Insights.
As for currency, the dollar strengthened, and the amount of money created by the Federal government caused an unprecedented demand for imports.
2022 Predictions:
In 2022, wage growth continues to increase as a percentage of GDP. The labor force participation and technology improvements will likely dampen inflation in Q4.
The USD still remains the fastest turtle. Rate hikes maintain strength, but uncertainty around CB policy keep us neutral on USD. GDP will likely stick around 4 – 4.5% growth with corporate profits decreasing as a percentage of GDP.
With Congress struggling to push through large stimulus bills, the Federal Reserve beginning to taper, and us approaching two years since the last market pullback, we expect a correction in 2022. The question is when? We know they won’t ring a bell at the top. Be diligent and be ready!
2021 Recap: Moving internationally, global GDP came in above 5%. China, Europe, and Japan continue to struggle economically due to demographic issues. 2022 Predictions: This year, we anticipate GDP to be about 4.25 – 4.75%, led by emerging markets (less China). The Chinese markets remain volatile, causing us to begin 2022 with an underweight as we continue to evaluate regulatory risk. Europe and Japan continue to struggle.
2021 Recap: Last year, valuations were stretched, which led to more names in the index. The recession cleaned up balance sheets, Earnings Per Share (EPS) expanded, and technology continued to lead after the value rotation. Finance and banking rose out of the bottom. 2022 Predictions: We expect valuations to become more moderate as terminal values contract with rising interest rates and share of corporate profits decreases.
EPS growth likely will stay strong, with target EOY S&P 500 earnings at $222 (8% earnings growth). This places the fair value at 5,000 – 5,100. Sectors to watch include Financial Services, Real Estate, and Technology.
2021 Recap: Municipal bonds tend to perform well if there’s a blue government, and this held true in 2021. Rates remained low, but inflation was higher than yields. We would argue we have a debt bubble … but one that is not quite ready to pop. Fixed Income
2022 Predictions:
It’s likely that interest rates will continue to rise, potentially putting the EOY 10-year Treasury Yield at 2.25 – 2.5%. Credit spreads will probably continue to widen modestly. Aggressive Investors will remain underweight to FI with the potential for FI and Equity to be correlated in pullbacks. Muni bonds look to be volatile and tied to tax policy, with a target duration of 0-3 years.
Conclusion
Clearly, there’s quite a bit of market activity to watch for in 2022. From Covid-19’s lessening impact on the market, to tightened monetary policy and emerging markets leading international GDP growth, we’ll keep you updated as these and other themes emerge.
Regarding a correction, we continue to believe we have a debt bubble. The Barclays Agg was negative last year in nominal dollars. CPI was 7% on the last release, so they lost tremendous value. Bonds are likely to continue to struggle, they can act as a ballast but keep your duration short to remove the risk of rising rates. The Fed will likely step in if the market begins to unwind.
Our Commitment
As always, the GWS Investment Committee is committed to the following investment management goals for our clients in 2022:
To pursue long-term returns that first and foremost strive to help clients work toward all goals in their financial plans.
To seek excess return above each portfolio’s benchmark over a three-year trailing time period and a full market cycle, in order to hopefully cover client fees and add surplus to their portfolios.
To implement investment strategies that align with each client’s personal volatility and benchmark sensitivity to help them remain confidently invested and long-term focused.
We’ll continue to provide updates on these and other market happenings, so be sure to subscribe to our YouTube channel so you never miss a Weekly Market Insight webinar (Wednesdays at 3:30 p.m. CT). We’ll see you there!
—
Disclosures
The opinions expressed are those of Aaron Tuttle and Gatewood Wealth Solutions as of the date stated on this material and are subject to change. There is no guarantee that any forecasts made will come to pass. This material is for general information only. This material does not constitute investment advice and is not intended to endorse any specific investment or security.
Please remember that all investments carry some level of risk, including the potential loss of principal invested. Indexes and/or benchmarks are unmanaged and cannot be invested directly. Returns represent past performance, are not a guarantee of future performance, and do not indicate any specific investment. Diversification and strategic asset allocation to not assure a profit or protect against loss.
When interest rates rise with fixed income securities and bonds, bond prices usually fall, because an investor may earn higher yield with another bond. Moreover, the longer the maturity of a bond, the greater the risk. When interest rates are at low levels, there is a risk that a significant rise in interest rates can occur in a short period of time and cause losses to the market value of any bonds that you own. The bond’s issuer is obligated to return the investor’s principal (original investment). As a result, high-yield bonds present greater credit risk than bonds of higher quality. Bond investors should carefully consider interest rate risk, credit risk, liquidity risk, securities lending risk, repurchase, and reverse repurchase transaction risk.
Securities and advisory services offered through LPL Financial, a registered investment advisor, Member FINRA & SIPC.
As the market continues to bounce back post-pandemic, we’ve seen some interesting themes emerge. This quarter, we’ve reported weekly on many of these topics, such as rising inflation, signs of economic recovery, the strength of the dollar, and the seasonality of market behavior — all while keeping a sharp eye out for signs of an impending correction.
Let’s dive into the key themes that emerged in Q3 and talk about whether or not there should be a concern for a correction.
Theme 1: Cautionary Components in our Dashboards
First, we’ll start with the yield curve. As a refresher, the yield curve graph shows yields, or interest rates, of bonds with equal credit quality but different maturity dates. So, for example, a normal curve reflects higher interest rates for 30-year bonds compared to 10-year bonds, which you might expect (a higher return for holding the bond longer).
Source: Yield Curve — GuruFocus
Think about it this way: banks can create money by loaning out their depositors’ cash, using a short-term payment and a long-term receipt. If the outcome is positive, it doesn’t matter where the interest rate is; banks can profit from lending long and borrowing short, which allows them to create credit (or money) in the system, bullishly affecting asset prices.
If the yield curve flips, banks begin to stop borrowing. Instead, they may call loans to pay depositors, which in turn shrinks the money supply.
This quarter, the yield curve showed a significant amount of movement. We ended the quarter close to where we started, but there was quite a bit of change over the last few weeks as rates came off their lower bound and moved back up 20 basis points (remember, a basis point is a hundredth of a percent). At the moment, we do not see a pullback. Demand for cash is greater than the demand for loans, so we likely don’t have to worry about a correction — yet.
Where is our concern coming from? We see from the following spider graphs that the money supply has dipped. Our spider graphs give a high-level look at how well the market is doing. Remember, the market is a forward-looking economic indicator, so it’s the first to dip.
In June’s graph, you can see an essentially robust economy, save for transportation and consumer sentiment. Those dips are primarily due to the chip shortage’s impact on vehicle purchases and resulting consumer sentiment.
Source: Internally created document from Factset data
Then, in July, we started seeing a deterioration in that bullish percent index. With the money supply dipping like this, we’re keeping a close eye on our dashboards for other signs of an impending correction. Now, moving into August, the money supply has slowed, and the bullish percent index is further down, which is concerning. But remember, it is customary to see a pullback in money supply as we get closer to September and October.
Source: Internally created document from Factset data
Theme 2: The Dollar as the “Fastest Turtle”
When it comes to the money supply, we see countries worldwide trying to solve the same problem: printing. Some are printing more money; others, less.
Compared to other major world currencies (e.g., the yen, euro, Canadian dollar, pound, krona, and franc), the dollar is quite strong. The continued strength is mainly because the U.S. dollar is a global currency, holding its demand. This gives the U.S. Federal Reserve an advantage over many other countries, as the global market makes the dollar more attractive.
Source: Yield Curve — GuruFocus
Next, let’s look at credit spreads on BBB (“triple B”) bonds, the lowest quality while still being investment grade.
Source: FRED Economic Data
The spread, or extra yield someone gets for taking credit risk, has remained constant throughout the quarter. Bondholders did get paid to hold a little extra credit, which is what the Morningstar graph shows at the bottom: higher-yield bonds performed well.
The data tells us so far; markets are not pricing in credit risk. Interest rates are moving up, but they’re doing so across the board. If we were to be moving into a recession, the bond market hasn’t predicted it yet.
Theme 3: Global Energy Problems Emerging
Basic materials and industrials were among the lowest-performing sectors in the U.S., reflecting a broader global energy issue. We haven’t seen oil prices as high as they are now in the U.S. since 2014. Furthermore, China is suffering an energy crisis due to a general global coal shortage and an unfavorable trade policy with Australia (which has since been revised).
Still, those aren’t even the biggest energy headlines this quarter. Instead, the main story here is Europe’s sky-high natural gas prices. In April, the price was under $20, but it’s already spiked to $117. These spikes ignite shock waves through the system, impacting fertilizer prices, ammonia plants, and greenhouses. In many ways, Europe’s food sector is simply not economically viable at these prices. We guess there will be a sharp market correction as gas prices get resolved, but we don’t know what that looks like yet.
Fortunately for the U.S., natural gas issues are somewhat regional, so we see a domestic impact, but it is not proportional.
Other Q3 Observations
While not standalone themes, there were other observations worth mentioning this quarter. The observations are:
The third wave of coronavirus did happen, but new medical options lessened its severity.
We see exports — not imports — grow as cargo ships struggle even to make it into port in the U.S., let alone get unloaded.
The U.S. grew more quickly than the global economy. Global GDP was only 5%, primarily due to issues with emerging markets (such as the Chinese real estate debacle).
Municipal bonds performed well, while taxable bonds stayed reasonably flat.
Secretary Yellen has called for a debt ceiling, saying we will default on bonds if we pass one by Oct. 18. We don’t think this will happen, as not enough people are pushing for it. If it does go through, we don’t believe the “Build Back Better Bill” will go through at its total proposed $5 trillion thresholds.
The Federal Reserve met in September to discuss their balance sheet. While their strategy isn’t finalized, they signal they will likely reduce those assets at the end of the year and continue mid-2022. About $600-700 billion in asset purchases will be added, growing the balance sheet to a bit of shy of $9 trillion. That’s still a lot of accommodative policy, but it’s a bit of a tightening relative to where we were.
Please contact your lead advisor about how these themes impacted the market and portfolio performance this quarter.
Conclusion
While we see early signs of an impending correction in our dashboards, we don’t believe there is cause for concern just yet. Still, if the yield curve starts dropping, you’ll find us becoming more conservative. We continue to keep a finger on the pulse of the market and will be sure to update you with important updates to our dashboards.
To learn more about correction concerns in Q3 2021, be sure to listen to our recap video below.
To ensure you don’t miss an update, join our live Weekly Market Insight webinars on our YouTube, LinkedIn, and Facebook accounts. We’re here to help make sure you’re doing the right things to preserve your wealth — a crucial part of our mission to help you become and remain financially self-reliant.
As always, feel free to reach out to your lead advisor with any questions or discussion points!
—
Disclosures
Securities and advisory services are offered through LPL Financial, a Registered Investment Advisor, Member FINRA/SIPC.
The opinions expressed are those of John Gatewood as of the date stated on this material and are subject to change. There is no guarantee that any forecasts made will come to pass. This material does not constitute investment advice and is not intended to endorse any specific investment or security.
Please remember that all investments carry some level of risk, including the potential loss of principal invested. Indexes and/or benchmarks are unmanaged and cannot be invested directly. Returns represent past performance, are not a guarantee of future performance, and do not indicate any specific investment. Diversification and strategic asset allocation do not assure a profit or protect against loss. When interest rates rise with fixed income securities and bonds, bond prices usually fall because an investor may earn a higher yield with another bond.
Moreover, the longer the maturity of a bond, the greater the risk. When interest rates are at low levels, there is a risk that a significant rise in interest rates can occur in a short period of time and cause losses to the market value of any bonds that you own. The bond’s issuer is obligated to return the investor’s principal (original investment). As a result, high-yield bonds present greater credit risk than bonds of higher quality. Bond investors should carefully consider interest rate risk, credit risk, liquidity risk, securities lending risk, repurchase, and reverse repurchase transaction risk.
Chinese real estate developer Evergrande had global markets on edge this week. As loyal listeners to our Weekly Market Insights might recognize, we called out the potential of China’s rapid expansion of their money supply to disrupt the market about two weeks ago (watch the replay here). Let’s dive into what caused China’s housing bubble, as well as what this could mean for the future of the global economy.
Chinese Housing: Bubble Decades in the Making
China’s real estate market leverage has been excessive for over a decade. As a result, there have been reports of substantial concrete structures being built. China has over-leveraged with more concrete units than households. Now, because China has been in a bubble for some time, they created a “three red line” policy.
Source: Media Reports, SG Cross Assets Research/Economics
With this policy, China will slow down its bubble and hope for a soft landing. Here are the metrics of the guidelines:
70% ceiling on the debt to asset ratios after excluding advanced receipts
100% cap on the net debt ratio
100% cap on short-term debt cash rate
According to a sales manager of Evergrande Wealth, “more than 80,000 people – including employees, their families, and friends as well as owners of Evergrande properties – bought WMPs that raised more than 100 billion yuan in the past five years.” They call themselves a conservative company; however, they promoted 11-13% rates of return for real estate and leveraged unconditional marketing tactics — such as giving away Gucci bags — to attract customers.
Overleverage
Source: Bloomberg
When we look at Evergrande as a whole, they have about $300 billion in total liability, and $7.4 billion of that is due over the next year. Then diving a little deeper, $850 million in interest payments is anticipated over the next year, and $150 million of that is due in the next two weeks.
Rising Risk
Many are calling this the Lehman Moment, which is referencing a contagion. We do not think China will make the same mistake; however, this does not prevent them from making new mistakes. In short, we do not believe it is a Lehman Moment, but there is a contagion. It will be felt throughout the economy. All economic activity is interconnected. For example, the risk of default and a distressed lender is moving high yield debt rates up in general. Other marginal borrows or distressed borrows are seeing their lending costs increase. It is being felt across the entire debt market. Or it is contagious. Is it enough to create a domino effect; unlikely since the PBOC will step in before this occurs.
A typical retort to the Lehman Comparison is Evergrande debt has tangible assets, not financial assets. First, real estate is both a tangible and financial asset. But the problem is not the physical aspect, but what people are willing to pay for something. Second, if real estate prices drop precipitously, it will not matter how tangible they are if they are pennies on the dollar. (As an example: here is a viral video of 15 tangible buildings being destroyed which were never completed:
The Debt Limit
Source: Goldman Sachs Global Investment Research
Another headline is the spending and debt limit bill that passed in the House on September 21st. It is currently sitting in the Senate. The bill has a suspension of the debt attached, but since it is a spending bill, the Republicans can filibuster it. They likely will play this game of chicken. The House Speaker is scheduled to deal with the infrastructure bill on the 27th. In short, there is little time, and the U.S. government could default in October if the debt limit is not extended. We expect accusations to fly, but ultimately the debt limit increase will be a separate bill that can be passed through reconciliation (Republicans cannot filibuster); however, the debt limit will not be suspended but only increased, meaning the big spending bill will be delayed. We are watching closely. We consider a default unlikely, but then the political climate is not conducive.
Keep up to date with the rising risk of Evergrande in China and more every Wednesday at 3:30 p.m. C.T. And to learn more about this week’s Weekly Market Insights, be sure to listen to our recap video on our YouTube channel and SUBSCRIBE!
—
Disclosures:
Economic forecasts may not develop as predicted, and there can be no guarantee that strategies promoted will be successful. Therefore, the opinions voiced in this material are for general information only and are not intended to provide specific advice or recommendations for any individual.
All performance references are historical and are no guarantee of future results. In addition, all indices are unmanaged and may not be invested directly.
Securities and advisory services are offered through LPL Financial, a registered investment advisor, Member FINRA/SIPC. All investing involves risk, including possible loss of principal. No strategy assures success or protects against loss.
The opinions in this material do not necessarily reflect the views of LPL Financial.
LPL Financial does not provide tax advice. This information is not intended as authoritative guidance or tax or legal advice. You should consult with your attorney or tax advisor for guidance on your specific situation.
The House Ways and Means Committee made waves Monday when it released a draft of significant tax legislation. Our GWS Planning Team spent the week dissecting these proposed changes to share a quick summary of the key points with you. We’ve already begun building some of the proposed changes into our scenario analysis tools to provide up to date “what if” illustrations reflecting potential impacts to our clients.
Below is a summary of the fundamental changes proposed, as well as related details and implications
House Democrats propose raising the top personal income tax rate to 39.6%, from 37%. That higher rate would reverse a cut signed into law by Trump. The committee also proposed a 3% surtax on individuals with an adjusted gross income of more than $5 million, an idea not included in Biden’s plans released earlier this year. However, this 3% surtax would also apply to trusts with an income of over $100,000.
The proposed top bracket would start at taxable income levels of $400,000 for single ($450,000 married filing joint); this is lower than the president’s plan previously released, which would have the top rate kick in at $452,700 and $509,300, respectively (adjusted annually for inflation).
Implications:
As a result, more high-income Americans would be subject to the top rate under the committee’s proposal. The proposed effective date is for taxable years beginning after December 31, 2021.
The House bill would increase the capital gains rate to 25% from 20%. In addition, a 3.8% Obamacare tax on investment would be added on top, meaning the richest would pay a 28.8% federal rate on realized investment returns.
This proposal is lower than the 43.4% top capital gains rate previously proposed by the president for those with adjusted gross incomes exceeding $1 million ($500,000 married filing separately).
Implications:
The new rate would apply to those in the top tax bracket for long-term capital gains, which in 2021 covers individual filers earning more than $445,850 and married joint filers earning more than $501,600, according to the Ways and Means Committee. The proposed effective date for a 25% capital gain rate is September 13, 2021. The proposed legislative text currently provides that any transactions completed on or before September 13, 2021, or subject to a binding written contract on or before September 13, 2021 (even if the transaction closes after September 13), are subject to the current 20% top capital gains tax rate. Any capital gains recognized after September 13, 2021, are proposed to be subject to the new maximum 25% rate.
This recent proposal would cut in half the estate and gift tax lifetime exemption from the current inflation-adjusted $10 million per person ($11.7 million in 2021) to an inflation-adjusted $5 million. This provision is not included under the president’s proposal, which instead sought to reform the taxation of capital income by creating a realization event at death – removing the “step up in basis.”
Implications:
The proposed change would apply to estates of decedents dying and gifts made after December 31, 2021.
Significant changes are proposed for the treatment of assets transferred to a “grantor trust.” Grantor trusts are trusts where the creator of the trust, the grantor, is deemed the owner of the trust for income tax purposes. In addition, the new legislation would require grantor trusts to be included in a descendant’s taxable estate when the descendant is the deemed owner. This provision was not included in the president’s proposals.
Implications:
Grantor trusts are an essential and frequently used planning tool for lifetime wealth transfers. Under the proposal, assets transferred to grantor trusts would be included in the grantor’s estate for federal estate tax purposes upon the grantor’s death.
#5 Changes to RMDs, After-Tax Contributions, “Back Door” Roth IRA, and Roth IRA Conversions
This legislation would limit contributions and increase the Required Minimum Distributions (RMD) for accounts over $10 millionand $20 million.
It would also eliminate the Back Door Roth IRA strategy for higher-earning taxpayers (with taxable income exceeding $400,000 or $450,000 for joint filers) starting in 2022. Currently, taxpayers may make nondeductible contributions to a traditional IRA and then convert the traditional IRA to a Roth IRA, regardless of income level.
Furthermore, this provision would prohibit all employee after-tax contributions in qualified plans.
Finally, this bill would eliminate the ability to do a Roth IRA conversion if you have more than $400,000 as a single individual or $450,000 married filing jointly; however, this would not be eliminated until 2031.
Implications:
This proposal included many changes to retirement plans for high-income earners, emphasizing eliminating the loopholes for growing IRA and Roth balances if you are over the high-income earning thresholds.
Expected Timing
Speaker Pelosi has indicated that the House plans to enact the infrastructure and the budget reconciliation bills by October 1. The bipartisan infrastructure bill has a planned vote in the House by September 27, which is the last stop before the bill goes to President Biden for signing, assuming the House passes it with no changes from the Senate version.
Congress also is coming up with several fiscal deadlines this fall, including considering a continuing resolution to maintain funding for federal departments and agencies, which is scheduled to expire on September 30.
While this is merely a proposal and may not be passed in its current form, it strongly indicates future law to come. Our GWS team will watch this legislation as it works through Congress and update you on any relevant planning considerations during the upcoming months. In the meantime, feel free to reach out to your lead advisor with any questions or concerns.
—
Disclosures:
Economic forecasts may not develop as predicted, and there can be no guarantee that strategies promoted will be successful. Therefore, the opinions voiced in this material are for general information only and are not intended to provide specific advice or recommendations for any individual.
All performance references are historical and are no guarantee of future results. In addition, all indices are unmanaged and may not be invested directly.
Securities and advisory services are offered through LPL Financial, a registered investment advisor, Member FINRA/SIPC. All investing involves risk, including possible loss of principal. No strategy assures success or protects against loss.
The opinions in this material do not necessarily reflect the views of LPL Financial.
LPL Financial does not provide tax advice. This information is not intended as authoritative guidance or tax or legal advice. You should consult with your attorney or tax advisor for guidance on your specific situation.
Over the last couple of decades, China has experienced more growth and development than we’ve seen in economic history. However, they typically measure growth using the size of their Gross Domestic Product (GDP). That’s a crude metric to use for the ability to project your power into the world.
Source: Business Insider
Above is a chart showing global GDP shares from a historical perspective. It is timestamped from 1000 A.D. to the present and represents the country’s percentage of the worldwide GDP. Production is based on how many people a country has, but it doesn’t tell you about its wealth within industries.
For example, in the 1800s, the United Kingdom’s economy grew dramatically, but the size of China’s economy dwarfed it. However, at the same time, the Opium Wars occurred, where the U.K. left England and defeated China time and time again. So, when we look at wealth per individual in this example, you can conclude many more resources were devoted to the English than to China.
Productivity of China
Source: FRED Economic Data
The graph above looks at how productive people are based on their tools in the economy. So, how effective are individuals in China? Not very productive at $11,000 in GDP, but we can see that their ability to produce products through the nineties and onward was multiplying. This is important because China’s debt grows substantially, and we haven’t seen any production increases. Up until recently, China has also been expanding its money supply five times the federal reserve rate.
Tech Crackdown
When doing business in China, you’re doing business with a communist party with much power over your business. They’ve shown this in the past with tech crackdowns as they have increased regulation, implemented antitrust fines, banned developments of D.D. (a ride-sharing app), and taken over private education.
Market Trades – China vs. the United States
Source: StockCharts
Analyzing how the market has been trading a year to date, you can infer more volatility in the Chinese index. But we see a big run-up in the market in 2021, which since has decoupled from the U.S. market. As a market share, the United States has been significantly outperforming the Chinese market. However, market trades are not the only issue China is dealing with.
Age Ratio
Source: TIME
The age ratio graph shows the young population at the bottom, the working people in the middle, and the elderly at the top. One of the big stories on why China grew drastically is because they have a high population and low labor costs. That means that as labor gets more expensive, there will be an issue with age ratios as China’s population peaks at 1.44 billion in 2029 before entering an “unstoppable” decline, according to a Chinese Academy of Social Sciences study released in January. Also, take into consideration China’s one-child policy. One legacy of the one-child policy is that each generation stands to inherit the wealth of four grandparents and two parents–the flip side of the “4-2-1” phenomenon.
Keep up to date with global GDP shares and more every Wednesday at 3:30 p.m. C.T. And to learn more about this week’s Weekly Market Insights, be sure to listen to our recap video on our YouTube channel and SUBSCRIBE!
——
For detailed performance metrics, please don’t hesitate to contact your lead advisor. And, in the meantime, be sure to keep up to date on Gatewood Wealth Solutions through our daily 3x3s and our weekly market insights on our YouTube, LinkedIn, and Facebook accounts.
Disclosures:
Economic forecasts may not develop as predicted, and there can be no guarantee that strategies promoted will be successful. Therefore, the opinions voiced in this material are for general information only and are not intended to provide specific advice or recommendations for any individual.
All performance references are historical and are no guarantee of future results. In addition, all indices are unmanaged and may not be invested directly.
Securities and advisory services are offered through LPL Financial, a registered investment advisor, Member FINRA/SIPC. All investing involves risk, including possible loss of principal. No strategy assures success or protects against loss.
The opinions in this material do not necessarily reflect the views of LPL Financial.
Hurricane Ida caught the news, as it left millions of people without power in New Orleans only 16 years after Hurricane Katrina. Natural disasters are great tragedies, but ultimately, we will focus our discussion on the effect on the economy.
Let’s start with the broken window fallacy, penned by French Economist Frederick Bastiat. This fallacy disproves the myth that the destruction of property is beneficial to the economy. So in a situation where there’s destruction, we may not see a change in GDP, but we do have a society with less wealth. So, therefore, we don’t measure the economic activity that is unseen.
Natural Disasters
Source: Wall Street Journal
When we look at natural disasters, hurricanes are one of the most consistent and significant ticket items. However, we do have a property and casually for these disasters because they are tragedies. But let’s take this and compare it to the same scenario from Frederick Bastiat, the seen versus unseen.
When you look at the New Orleans economy, it’s going to look like it’s been stimulated by GDP because there is a transfer of money that has been sent to replace the infrastructure that Hurricane Ida has destroyed. So, this is the “seen” part. But what we won’t see is the money that the property and casualty companies would have used and saved for other investments to fund future catastrophes, where they would have to payout. So, therefore, we are not losing our spending as an economy but all the innovation that would have come from the property’s investments.
Storm Costs
Source: Wall Street Journal
Another thing that happens a lot whenever hurricanes come about is the severity of storms and that storms are getting worse. It is likely not the severity of the storms driving these costs up over time; we are developing areas in our communities.
So if, if we had a storm come through and it’s across the beach, and there’s no development whatsoever, we’re not going to account for all the different changes that happened in the environment because there was no economic component. So, therefore, as our economy continues to grow, the additional infrastructure increases.
Florida
So let’s analyze Florida because hurricanes are typically the most significant event that we see in Florida.
Source: Thirty Thousand Pages
We can look at the population growth for Florida and see 1960 Florida is not the same as present-day Florida. When we talk about the electoral college, Florida has a significant influence. It’s one of the most populated states in the country, but not the case in the 1960s. We can see that the population since the 1960s has increased. So you may be thinking the population increases everywhere, so why Florida?
Source: Thirty Thousand Pages
Well, we can see how the population influences Florida as the house of representatives increases over time. In 1944 they had six representatives; by ’64, they had 12, and in 2004 they had 25. This number is likely to go up with the number of people continuing to move to that state. But all the increase in population means that beaches that were empty before now have all kinds of infrastructure surrounding them. So whenever a hurricane comes through, there are more places to hit and what’s driving the increased costs.
Infrastructure Spending
Source: The White House
Infrastructure spending has been moving slowly, and there has been a lot of going back and forth with politics. Janet Yellen wanted to get the $3.25 trillion passed before the infrastructure bill, but the Senate has now approved an additional $550 billion in spending. The extra $550 billion is set to be voted on September 27th.
Although natural disasters come and go, our economy can take the hit for longer. Keep up to date with the effects of Hurricane Ida on our economy and more every Wednesday at 3:30 p.m. CT. And to learn more about this week’s Weekly Market Insights, be sure to listen to our recap video on our YouTube channel and SUBSCRIBE!
——
For detailed performance metrics, please don’t hesitate to contact your lead advisor. And, in the meantime, be sure to keep up to date on Gatewood Wealth Solutions through our daily 3x3s and our weekly market insights on our YouTube, LinkedIn, and Facebook accounts.
Disclosures:
Economic forecasts may not develop as predicted, and there can be no guarantee that strategies promoted will be successful. Therefore, the opinions voiced in this material are for general information only and are not intended to provide specific advice or recommendations for any individual.
All performance references are historical and are no guarantee of future results. In addition, all indices are unmanaged and may not be invested directly.
Securities and advisory services are offered through LPL Financial, a registered investment advisor, Member FINRA/SIPC. All investing involves risk, including possible loss of principal. No strategy assures success or protects against loss.
The opinions in this material do not necessarily reflect the views of LPL Financial.
Testimonials
"What has stood out most over our decade-long relationship with Gatewood is how genuinely they listen. Our advisor takes the time to understand our full financial picture and has made a point to build a relationship with my wife as well, so she feels comfortable working with the team whether I'm present or not. Having everything coordinated in one place, with great online tools at our disposal, has been invaluable. Our team is responsive whenever we have questions and has always followed through with care and professionalism. Beyond the planning itself, it's the personal relationships we've developed that make this…"
"Our relationship with Gatewood Wealth Solutions has evolved over the years right along with our family. From building and protecting our wealth to retirement and estate planning, Gatewood has guided us and enabled our objectives. It’s assuring to know skilled professionals we trust are working with us to optimize what we have worked for all our lives."
"My wife and I have had the benefit of working with John Gatewood for over thirty-five years. Initially, John worked with us planning our personal and business life insurance needs. As his service offerings expanded, we took advantage of his expertise to help us with our family's financial planning. We could not be more pleased than what we are with the plan the Gatewood Wealth Solutions team developed for us. The team members are well-trained, intelligent, friendly, enthusiastic, and very good listeners. We have two scheduled reviews of the plan every year with one of the principals and at least…"
"My wife and I have known and worked with John Gatewood and his team for nearly a decade. The values-driven team of Gatewood Wealth Solutions is motivated, caring, highly competent and personally fueled by character and integrity. I recommended Gatewood to friends and family - including my children - because their deep desire to help clients 'give purpose to their wealth' gives us all the opportunity to better serve our families and communities."
"Navigating the complexities of my corporate life was already a challenge, but when my husband passed away, it felt like an insurmountable mountain of emotions and paperwork. The team at Gatewood Wealth Solutions stepped in with compassion, efficiency, and expertise, guiding me through the entire estate settlement process. Their unwavering support made a world of difference during such a challenging time. I am profoundly grateful for all they've done and continue to do for me. Their services are truly unparalleled, and I wholeheartedly trust and recommend them."
"My wife and I became a client of Gatewood Wealth Solutions twelve years ago on the recommendation of a friend who was also a Gatewood client, and I am very glad that we did. Until that time, I had managed our 401(k) and investments, but with retirement on the horizon, we felt it important to get professional help for retirement planning and investment management. The Gatewood team developed an integrated financial and retirement plan that we refined together. It was based on information such as our current financial position, desired retirement date and lifestyle, anticipated job and retirement income, expenses,…"
"I have worked with Gatewood Wealth Solutions since its inception and could not speak more highly of my experience. Gatewood Wealth Solutions provides comprehensive wealth management services for my family in a very sophisticated way. Their planning services are comprehensive and consider all assets of our family, not just what they manage. This is important for our family since we have a real estate business which must be considered in our planning. They also help us with our estate and tax planning each year. Their service is exceptional and is proactive and not reactive. I have referred members of my…"
"I’ve been with Gatewood Wealth Solutions and its predecessor for 21 years as our financial advisors. I first met John Gatewood in 2002 when I purchased a life insurance policy from him when he was with Northwestern Mutual. Shortly after having additional discussions with John, we started using them as our only financial advisors. They continued over the years to more than perform above my expectations and also started to bring in additional talent within their organization in order expand and meet client’s expectations. Since they’ve organized as Gatewood Wealth Solution and separated from Northwestern Mutual, they’ve continued to add…"
"I have been with Gatewood Wealth Solution for seven years, and I would highly recommend them for wealth management services. They are a very efficient, effective, knowledgeable team that provides highly personalized, client-centered services. If I didn't know better, I would think that I am their only client! They have an excellent working relationship with a highly respected law firm that provides assistance with trusts and estate planning. They also have an excellent working relationship with a tax accounting firm. All of this so that all aspects of my financial planning needs are seamlessly coordinated. Their quarterly meetings are well…"
"Partnering with Gatewood Wealth Solutions has been one of the best decisions we have made in the last five years. I have met with numerous financial planners who’ve all come to me with similar ideas and recommendations that don’t seem to prove that they are thinking outside the box for me individually. But when Gatewood came to me with their plan it was strategically designed with so many aspects taken into consideration that I was surprised at how uniquely competent and professional they were. They brought me many ideas and recommendations that would not bring them profit. They brought me…"
"Gatewood Wealth Solutions gives me confidence that my retirement savings are being monitored and managed with MY best interest in mind. All of the staff is welcoming, friendly and respectful. They have comprehensive knowledge of long-term financial planning, estate planning and tax planning. I have been with Gatewood for many years and hope to be with them for many more years to come."
"I have known John Gatewood, the founder of Gatewood Wealth Solutions, for many years. We became friends well before we talked about business, and it was a natural decision to turn to John for help with our affairs when I needed it because I had grown to know and trust him. It really is true that John and his team at Gatewood Wealth Solutions are completely focused on helping ordinary families like ours to become financially independent. The family part especially means something: One day my 20-something son called to ask if I thought our group would be willing to…"
The statements provided are testimonials by clients of the financial professional. The clients listed have not been paid or received any other compensation for making these statements. As a result, the client does not receive any material incentives or benefits for providing the testimonial. These views may not be representative of the views of other clients and are not indicative of future performance or success.