Ten months ago, the sky was falling.
Sweeping tariff announcements sent the S&P 500 plunging nearly 20% from its February 2025 peak, wiping out over $6 trillion in market value in two trading sessions. Headlines screamed recession. Pundits predicted the worst. The temptation to sell everything and hide in cash was overwhelming.
Here’s what our clients did: absolutely nothing.
Their strategy, Fortress Gatewood, held. Their fortress held. Their portfolios recovered, and then some.
Zero families served by Gatewood Wealth Solutions panic sold during the 2025 market correction. Not one.
Today, the S&P 500 is trading near all-time highs. But we’re not writing this to celebrate. We’re writing it because the next correction is coming, and the real question is whether you’ll be ready.
What Happened: The 2025 Tariff Correction
On February 19, 2025, the S&P 500 closed at an all-time high of 6,144.
Then things got ugly. Fast.
- February 19 to March 13: The S&P 500 dropped over 10% on tariff fears alone, entering correction territory before “Liberation Day” even arrived.
- April 2 to April 8: Sweeping tariffs on nearly all U.S. trading partners triggered the worst two-day loss in S&P 500 history. The VIX spiked to levels not seen since the COVID-19 pandemic.
- April 8: The bottom. The S&P 500 sat nearly 19% below its February peak, flirting with official bear market territory.
Then, just as quickly, the reversal. A 90-day tariff pause on April 9 sent the S&P 500 surging 9.5% in a single session, one of its best days ever. By May 13, the index was positive for the year. By June 27, it hit a new all-time high.
From the April 8 bottom to today, the S&P 500 has gained roughly 40%.
The entire round trip took about four months. Investors who sold at the bottom missed all of it.
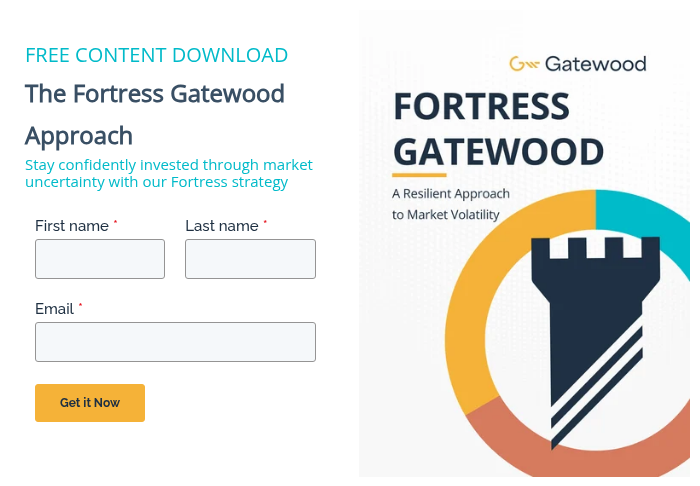
What Is Fortress Gatewood?
Fortress Gatewood is the planning framework we use to help families navigate market volatility without being forced into reactive decisions. It’s built around intentional layers (or “moats) of liquidity, income, and long-term growth, each aligned to different time horizons and real-world spending needs.
By clearly separating short-term cash needs, intermediate income sources, and long-term growth capital, the structure helps clients understand which dollars are meant to be used now, which are designed to support future income, and which are positioned for long-range objectives.
The goal isn’t to predict markets, but to create enough flexibility and clarity that market movement doesn’t dictate decisions when it matters most.
Download Your Free Copy
How the Fortress Worked
This is exactly the scenario Fortress Gatewood was designed for.
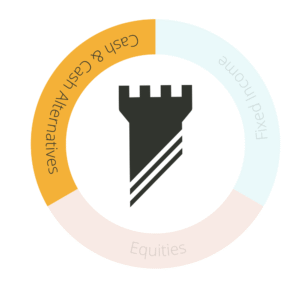
Moat Ring 1: Cash. Two years of spending in liquid reserves. No one needed to sell a single share to pay their bills. No forced selling. No panic.
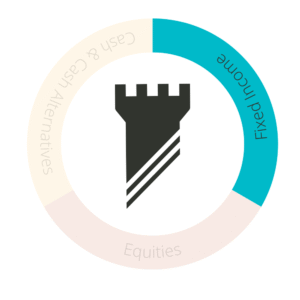
Moat Ring 2: Fixed Income. Five to eight years of high-quality bonds provided less volatility with stable income. A second wall of defense while equities took the hit.
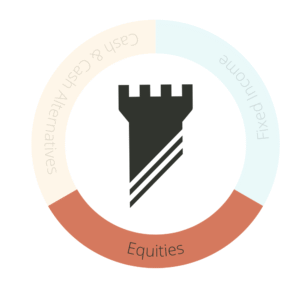
Moat Ring 3: Equities. Long-term growth capital with a 7 to 10+ year horizon. Because no one was relying on these funds for near-term needs, they could ride the storm and capture the rebound.
But here’s what made the difference: we didn’t just defend. We attacked.
On April 7, 2025, one day before the market bottomed, Chris Arends and the Gatewood Investment Committee sent guidance to every advisor on the team:
“Please contact clients with dry powder and suggest investing 1/2 to strategy now. Dry powder means funds not earmarked for short-term or mid-term spending needs. It must be long-term (>7 years).”
— Chris Arends, Gatewood Investment Committee, April 7, 2025 at 8:47 AM
That’s not a memo written in hindsight. That’s real-time guidance, issued the morning before the market hit its lowest point.
Dry powder means long-term capital not earmarked for short-term or mid-term spending. Funds with a 7+ year horizon. Because Moat Rings 1 and 2 were fully funded, we knew exactly which dollars could go to work at depressed prices, and we deployed them with conviction.
As our investment partner, Aaron Tuttle, said that same morning:
“Since 1957, we’ve had 12 corrections in the S&P 500 greater than 20%. Half were between 20-30%, three were between 30-40%, and three were greater than 40%. If you have a lot of cash, don’t overcomplicate it. Invest half now, another quarter at a 30% drop, and go all-in, buying everything you can at a greater than 40% drop. You might only get one or two opportunities at that level in your lifetime.”
Other investors were frozen. Ours were buying.
That’s the power of a fortress.
The Bigger Picture
The 2025 correction joins a pattern every investor should know by heart:
| Market Event | Decline | Recovery Time |
| Dot-Com Crash (2000–2002) | -49.1% | 7.2 Years |
| Global Financial Crisis (2007–2009) | -56.8% | 5.5 Years |
| COVID-19 Crash (2020) | -34% | ~6 Months |
| 2022 Bear Market | -27.5% | ~2 Years |
| 2025 Tariff Correction | ~19% | ~4 Months |
Every single one felt like the end of the world. Every single one recovered. Every single time, the investors who stayed disciplined won.
But Here’s What Should Keep You Up at Night
“The biggest risks are always the ones nobody sees coming. The events that aren’t on anyone’s radar are what move the world most. People are generally good at predicting the future except for the surprises that actually matter.”
— Morgan Housel, Same as Ever
The 2025 correction was the easy version. No recession. Strong consumer spending. Resilient corporate earnings. Room for the Fed to cut rates. The economy absorbed the shock and bounced back in months. V-shaped recovery!
That won’t always be the case.
When we study the last 50 years of S&P 500 bear markets, the data is clear: the presence or absence of a recession changes everything.
Bear Markets Without a Recession (1987, 2022)
| Metric | Average |
| Decline | -30% |
| Peak to Trough | ~6.5 months |
| Full Round Trip | ~23.5 months (~2 years) |
Bear Markets With a Recession (1980–82, Dot-Com, GFC, COVID)
| Metric | Average |
| Decline | -42% |
| Peak to Trough | ~17.5 months |
| Full Round Trip | ~46 months (~3.8 years) |
Recessionary bears are 12 percentage points deeper. The decline phase is 3x longer. The total round trip takes twice as long.
And if you exclude the anomalous COVID recovery (compressed by unprecedented government intervention), the three traditional recessionary bears averaged about 5 years from peak to recovery.
Since 1975, four out of six bear markets have coincided with recessions. We are statistically due for another one. The question isn’t if. It’s when.
Are you building your fortress now, while the sun is shining? Or will you try to build it in the middle of the storm?
The Danger of All-Time Highs: Complacency
Here’s the part most people don’t want to hear: all-time highs are when fortresses get built, not when they get tested.
Right now, with markets at record levels and three straight years of strong returns behind us, it’s tempting to relax. To assume the good times will continue indefinitely. To skip the disciplined work of maintaining cash reserves and rebalancing into fixed income.
But the 2025 correction is a reminder that the next downturn doesn’t send a calendar invite. It shows up unannounced, sometimes triggered by a single speech in a Rose Garden.
At Gatewood, we use times like these—when markets are at all-time highs—to strengthen our clients’ defenses. We take profits strategically. We replenish cash reserves. We make sure the moat is full before the next storm arrives.
What We’re Doing Now
With the S&P 500 near 7,000 and all-time highs stacking up, most investors are relaxed. We’re not.
We’re using this moment of strength to prepare for the next moment of weakness:
- Reviewing cash positions to make sure every client has their full 2-year liquidity buffer
- Rebalancing into fixed income to lock in yields and maintain the 5 to 8 year spending bridge
- Harvesting equity gains to fund and strengthen the outer moat rings
- Stress-testing every plan against recessionary scenarios: 40%+ drawdowns, multi-year recoveries, rising unemployment
We’re not predicting a crash. We never do. We’re preparing for one, because that’s what we always do.
The Firm to Family® Advantage: Why the Fortress Held
Zero panic selling across our entire client base is not an accident. It’s the result of how Gatewood is built.
At most firms, the investment team doesn’t talk to the financial planner. The financial planner doesn’t talk to the tax advisor. And nobody coordinates the message to the client when markets are in freefall.
At Gatewood, our Firm to Family® structure means every professional who touches your financial life is working from the same plan, communicating continuously, and aligned on the same strategy.
When markets dropped in April, your wealth planner could tell you with precision how many months of expenses were covered without touching a single equity position. The Investment Committee was providing real-time guidance on deploying dry powder. And the planning team was tracking the tax implications of every move to make sure nothing was done without considering the full picture.
Our clients didn’t panic because they didn’t have to. They had a plan, a team, and a fortress. And they heard from their advisor, personally, before the bottom even arrived.
That’s the Firm to Family® difference. Not one department. Not one product. One integrated team serving your entire family.
Build Your Fortress While You Can
The 2025 correction proved the Fortress Gatewood system works. Our clients didn’t panic. They didn’t sell. They didn’t miss the recovery. Zero families. Zero panic sales. Many of them used the downturn to buy at depressed prices and came out stronger on the other side.
But the next test might not be a four-month correction. It could be a recessionary bear market that grinds on for years. The families who navigate that with confidence will be the ones who built their fortress today, while markets were strong and emotions were calm.
Don’t wait for the storm to start digging the moat.
Important Disclosures
Content in this material is for general information only and not intended to provide specific advice or recommendations for any individual. Gatewood Wealth Solutions and LPL Financial do not provide legal or tax advice or services.
All investing involves risk including loss of principal. No strategy assures success or protects against loss.
The opinions voiced in this material are for general information only and are not intended to provide specific advice or recommendations for any individual. All performance referenced is historical and is no guarantee of future results. All indices are unmanaged and may not be invested into directly.
This information is not intended to be a substitute for specific individualized tax or legal advice. We suggest that you discuss your specific situation with a qualified tax or legal advisor.
Bonds are subject to market and interest rate risk if sold prior to maturity. Bond values will decline as interest rates rise and bonds are subject to availability and change in price.
The S&P 500 Index is a capitalization-weighted index of 500 stocks designed to measure performance of the broad domestic economy through changes in the aggregate market value of 500 stocks representing all major industries.
Appendix: Sources
S&P 500 Historical Data & 2025 Market Correction
- S&P Dow Jones Indices. S&P 500 historical closing prices.
- “2025 Stock Market Crash.”
- NBC News. “S&P 500 Hits an All-Time High—Rebounding to Its Level When Trump’s Second Term Began.” June 27, 2025.
- CBS News. “The Stock Market Is Nearing a Record High After Cratering in April. Here’s Why.” June 27, 2025.
- “How the Stock Market Made Back All Its Losses After Trump Escalated the Trade War.” May 4, 2025.
- CNN Business. “What to Expect From Stocks in 2026.” January 1, 2026.
- S. Bank. “Stock Market Under the Trump Administration.” Updated February 4, 2026.
- Trading Economics. “United States Stock Market Index.” February 10, 2026.
- Bank for International Settlements. “Understanding the Swift Market Recovery After the April 2025 Tariff Shock.” BIS Quarterly Review, September 2025.
April 2025 Tariff Crash Details
- CNN Business. “Dow Plunges 2,200 Points as Tariff Tumult Rocks Markets.” April 4, 2025.
- “Tariff Shock: Top S&P 500 Winners and Losers (April 2–16, 2025).”
Bear Market Historical Data & Recession Analysis
- S&P 500 bear market peak-to-trough and recovery data, 1975–2025.
- S&P 500 historical performance and earnings data.
- National Bureau of Economic Research (NBER). S. business cycle expansions and contractions.
- “A History of Bear Markets.”
- “A History of Stock Market Percentage Declines (15% to 50%).”
- “Here’s How Often Stocks Dip 5% or More.”
- Austin Wealth Management. “Dealing With the Dips.”
2026 Market Outlook & Valuation
- The Motley Fool. “With the S&P 500 at an All-Time High to Start 2026, Is It Smart to Buy Stocks?” January 9, 2026.
- The Motley Fool. “History Says a Turning Point Is Likely Coming for the S&P 500 in 2026.” January 1, 2026.
- Visual Capitalist. “152 Years of S&P 500 Returns (and Predictions for 2026).” January 2026.
- Advisor Perspectives. “S&P 500 Snapshot: Index Closes at Record High.” January 2, 2026.
Books Cited
- Housel, Morgan. Same as Ever: A Guide to What Never Changes. Portfolio/Penguin, 2023.